Energy · Comprehensive complex · Risk decomposition
Comprehensive energy complex decomposition
Every contract across the energy complex — ICE Europe, ICE US Energy Division (IFED), NYMEX/CME, and Nodal Exchange — decomposed in your browser into dated factor legs with per-leg product codes. Outrights, strips, calendar spreads, CSOs, bullet options, basis swaps, heat-rate futures, refining cracks — every structure handled. v3 extends the universe to 430+ factors across 470+ contracts, applies a single hierarchy across all of it (gas delivery points regionalized, power zones mapped to their marginal gas hub, crude organized by region × grade × application), and layers in open interest and volume per contract.
Drive it below — hit "Load sample" for a mixed portfolio spanning every sector, paste your own CSV, or open the Playbook tab: five strategy archetypes (locational, term-structure, crack, heat-rate, cross-venue) plus the new ATLAS vs VECTOR case study — a $5.07B offset book against a $2.66B conviction book, and why the bigger one is the safer one. Full coverage breakdown, what's under the hood, and limitations are below the dashboard.
Downloads & artifacts
The CSVs load directly into the dashboard's Portfolio Analysis tabCoverage · Sectors · Exchanges
What the engine covers.
Every sector below is decomposed by the same engine driving the dashboard above — 430+ atomic risk factors across 470+ contracts, spanning ICE Europe, ICE US Energy Division (IFED), NYMEX/CME, Nodal, and Nasdaq. Natural gas is organized by delivery-point region, power by ISO → Hub → Zone with each region mapped to its marginal gas hub, crude by region × grade × refining application, and refined products by exchange geography with the full East–West and crack spread suite. Open interest and daily volume ride along per contract (snapshot as of June 30, 2026 — CFTC COT, exchange releases, and clearly-flagged estimates).
Coverage by sector
ICE EU · ICE US (IFED) · NYMEX · Nodal · CME · NasdaqNatural gas
70+ delivery points- Gulf — Texas & LouisianaHenry, HSC, Katy, Carthage, Agua Dulce, TETCO STX/ETX/WLA/ELA/M1, Columbia Gulf Mainline & Onshore, Texas Gas Z1/SL, Tennessee 500/800/Z0, Trunkline ELA, Transco Z3, ANR SE
- Appalachia / NortheastTETCO M2/M3, Dominion South/North, TCO Pool, Leidy, Tennessee Z4/Z6, REX Z3, Millennium, Lebanon, Transco Z6 NY & non-NY, Algonquin, Iroquois Z2, Niagara
- Midcontinent / MidwestChicago, MichCon, Consumers, Dawn, Ventura, NNG Demarc, Emerson, ANR ML7, NGPL Midcon/TexOK, Panhandle, Southern Star, OGT, REX Z2
- Rockies / West / Pacific NWOpal, CIG, Cheyenne, Questar, White River, NWP Rockies, SoCal Border & Citygate, PG&E Citygate, Malin, Kern, EP South Mainline, San Juan, Sumas, Stanfield, Kingsgate
- Permian & CanadaWaha, El Paso Permian, Transwestern Permian, Bondad; AECO/NIT, Station 2, Empress
- Europe + AsiaTTF, NBP, THE, PEG, PSV, Zeebrugge, CEGH, Czech VTP, JKM (Asia LNG)
- Cross-exchangeCME/NYMEX basis futures duplicated at the 12 most-hedged hubs — same factor, separate clearing house, so venue offsets surface explicitly
Power
ISO → Hub → Zone, peak + off-peak- PJMWestern/AD/NI/Eastern hubs + 18 zones (AECO · AEP · APS · ATSI · BGE · ComEd · DAY · DEOK · Dominion · DPL · Duquesne · JCPL · Met-Ed · PECO · PEPCO · PPL · PSEG · RECO), peak and off-peak
- ERCOTNorth · Houston · South · West hubs plus 8 load zones (incl. Austin Energy, CPS, LCRA, Rayburn)
- NYISO / ISONENYISO Zones A–K; Mass Hub plus CT · NH · ME · RI · VT · WCMA · NEMA · SEMA
- MISO / SPP / CAISOIndiana · IL · MI · MN · LA · AR · TX hubs; SPP North & South; CAISO NP15 · SP15 · ZP26
- WECC bilateralMid-Columbia · Palo Verde · Mead (index-settled)
- Gas associationEvery US power region mapped to its marginal gas hub with typical heat-rate bands — plus listed heat-rate (spark) futures that decompose into both legs
- EuropeICE Endex Dutch (Base + Peak), Belgian Base, German Base/Peak, French, UK, Spanish, Italian, Nasdaq Nordic
Crude
Region × grade × application- BenchmarksWTI (NYMEX + ICE + Micro), Brent (ICE + NYMEX financial), Dubai (ICE), Murban (IFAD), Dated Brent complex (CFDs, DFL, EFS)
- Grade differentialsLLS · HLS · Mars · ASCI · WTS · Bakken · WTI Midland & Houston (MEH + NYMEX physical) · WCS Hardisty & Houston · Johan Sverdrup
- Quality spreadsBrent–WTI, Brent–Dubai EFS, Murban–Dubai, Mars–WTI sweet-sour, WCS Houston–Hardisty, Midland–Cushing
- TaxonomyEvery grade classified by API gravity, sulfur, quality class (light-sweet → heavy-sour) and refining application — rendered as a grade matrix in the Market Map
Refined products
3 regions + East–West- NYMEX / USRBOB · NY Harbor ULSD · Group Three & Chicago product basis · Chicago Ethanol · Gulf Coast Jet 54 / ULSD / HSD · LA CARBOB
- ICE EuropeGasoil (LSGO) · Eurobob (EBOB) · CIF NWE Naphtha · Jet Kerosene · 3.5% Rotterdam Fuel Oil · Marine 0.5% Rotterdam
- ICE AsiaSingapore Gasoil 10ppm · Jet Kero · Mogas 92 · Fuel Oil 380/180cst · Marine 0.5% · MOPJ Naphtha
- Spread suite3:2:1 and 2:1:1 cracks, gasoil/RBOB/ULSD/naphtha/HSFO cracks, Sing Gasoil–Dubai, jet regrades, HOGO, Hi-5, visco, and gasoline/gasoil/fuel-oil/naphtha East–West
NGLs
Belvieu · Conway · FEI · CP- Mt Belvieu (USGC)Propane LDH · Normal Butane · Isobutane · Purity Ethane · Natural Gasoline
- Conway + internationalConway Propane · Argus FEI (Far East) · Saudi CP · pronap and CP–FEI arb spreads
Emissions · Coal · LNG
Global- EmissionsEUA (EU Phase IV) · UKA · California CCA · RGGI
- CoalAPI2 (Rotterdam) · API4 (Richards Bay) · Newcastle (Australia)
- LNGPlatts JKM (Japan / Korea Marker)
The thesis
Energy portfolios live or die by how positions are decomposed.
A calendar spread isn't one exposure — it's a pair of dated legs whose basis can dominate the P&L. A power Cal-strip doesn't scale evenly across months because peak-hour counts differ. A 3:2:1 crack's constituents move on different ICE codes. If your risk system papers over any of that, every downstream report carries an invisible error.
This project is what happens when you take that observation seriously: a decomposition library — ice_energy_decomp — that expands every contract type into dated factor legs with per-leg ICE codes, and a browser dashboard whose calculation engine is checked cell-for-cell against the Python reference. The point isn't the dashboard itself. The point is that the decomposition is what every downstream calculation (margin, P&L, scenario, value-at-risk) needs to start from.
The features, illustrated
What the dashboard does — view by view.
Feature index
Click a feature to jump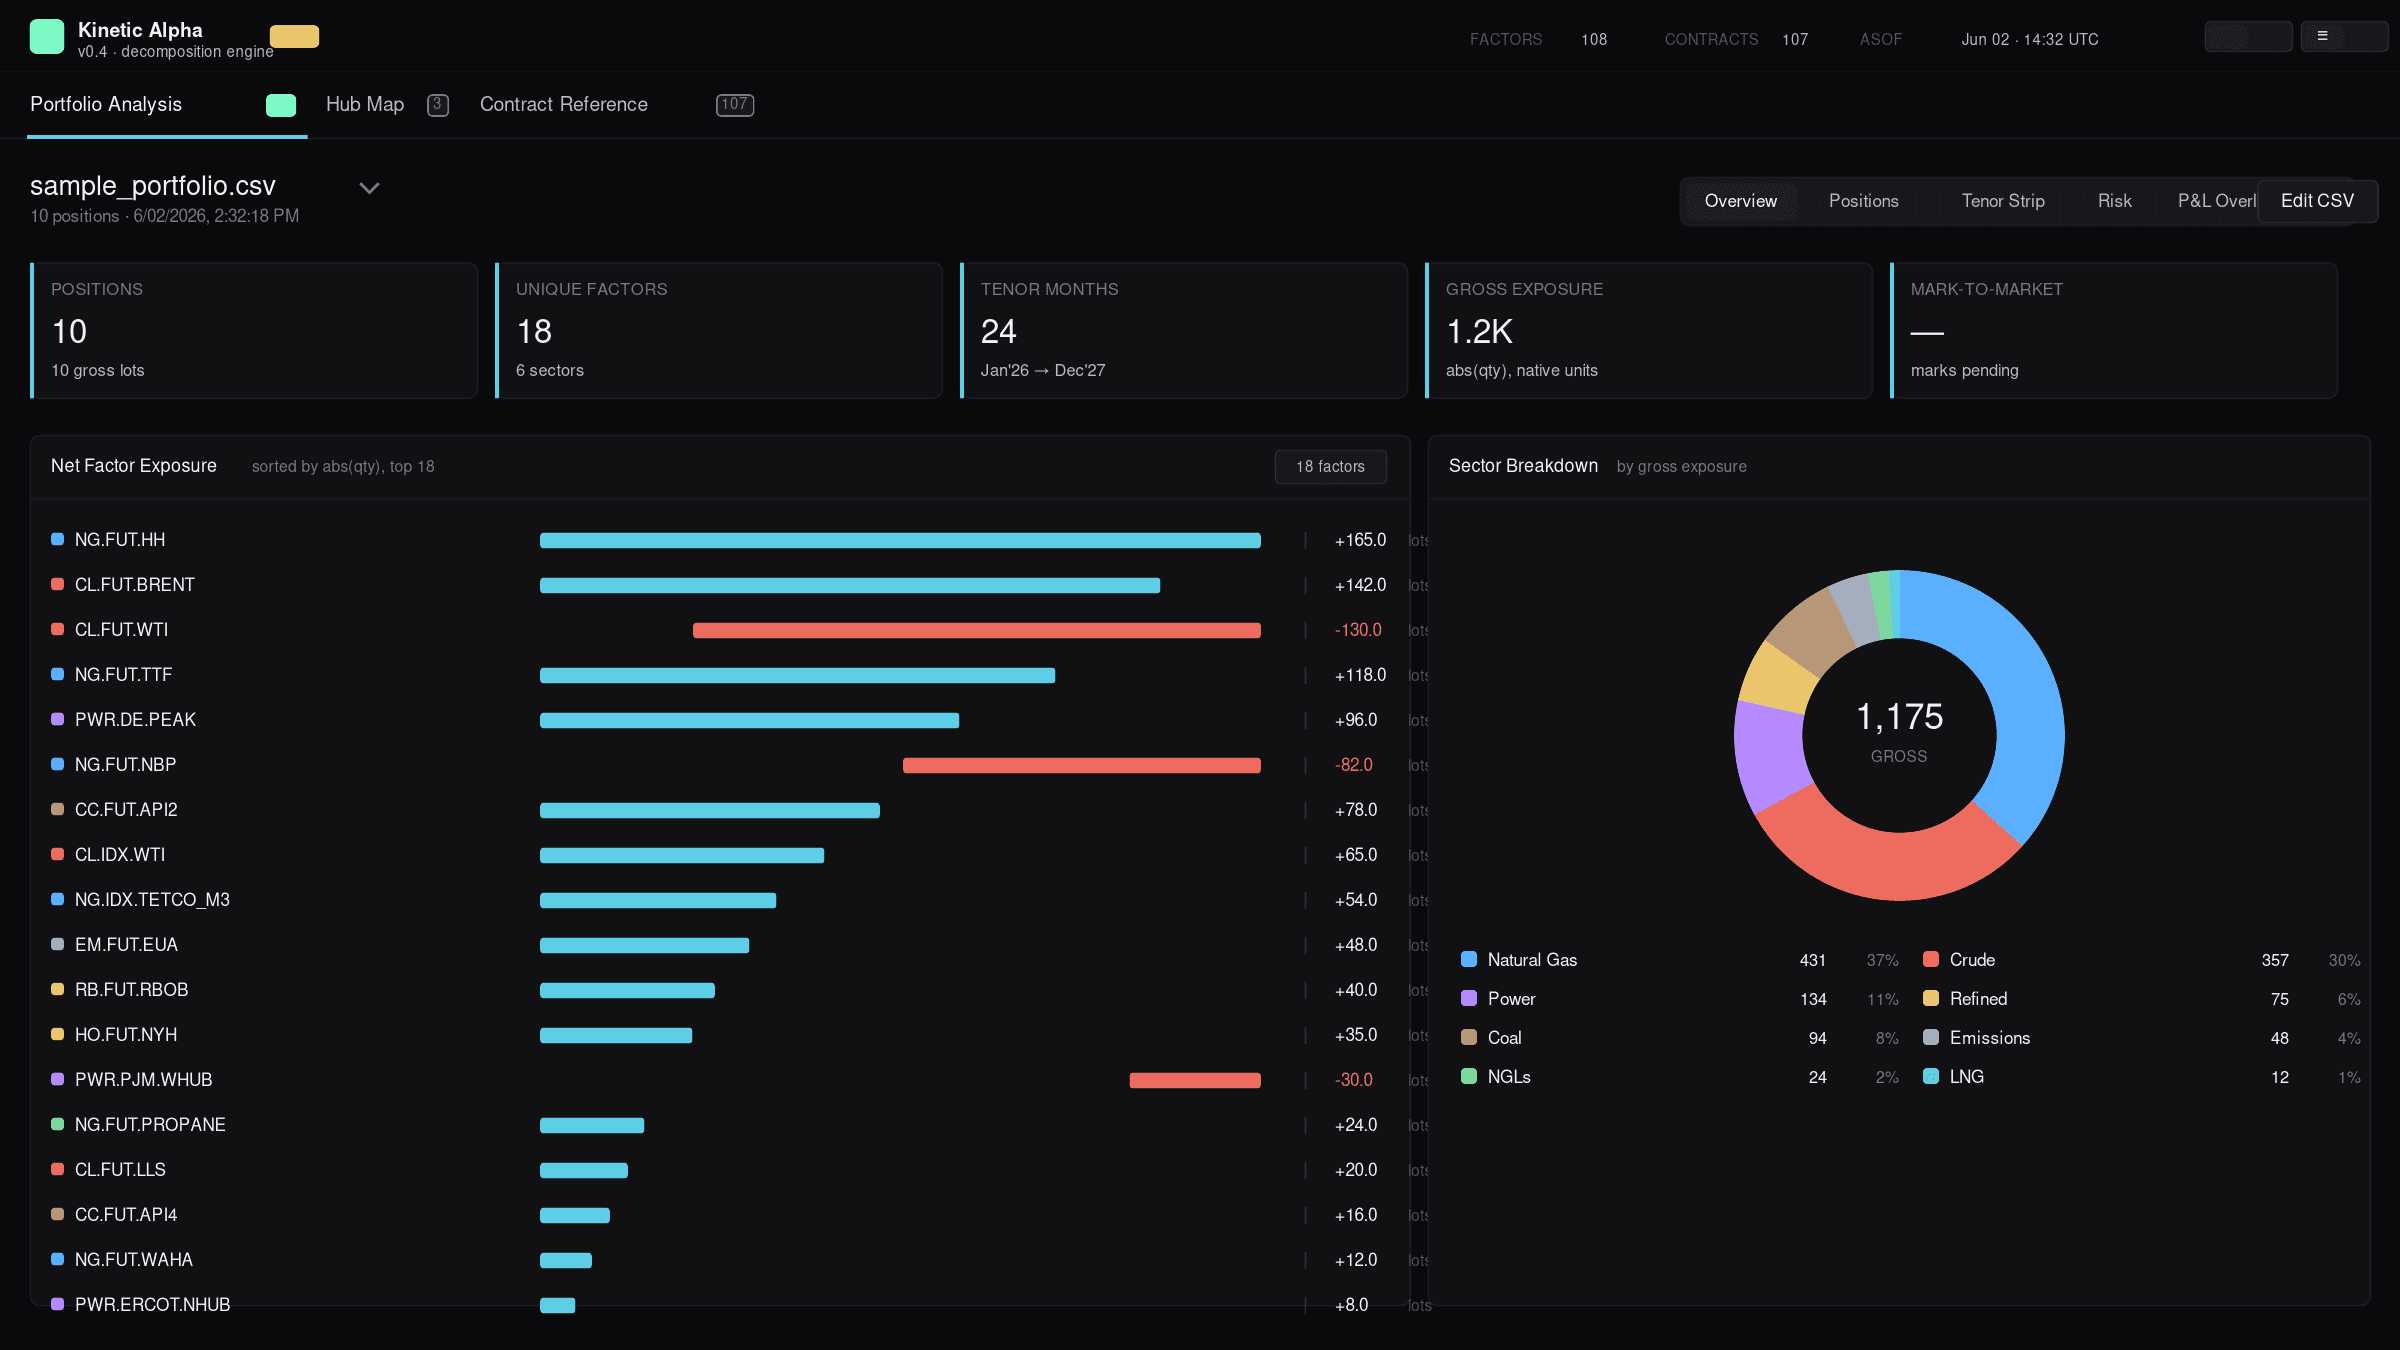
Overview — your book in one frame
A KPI strip (positions, unique factors, tenor span, gross exposure, mark-to-market), the net factor exposure list ranked by abs(qty) with left/right bars, and a sector breakdown donut. Compare a second portfolio side-by-side from the switcher.
Sector donut tells you instantly whether your gross is concentrated in one sector or spread across the complex — the single most underrated risk visualization for a multi-commodity book.
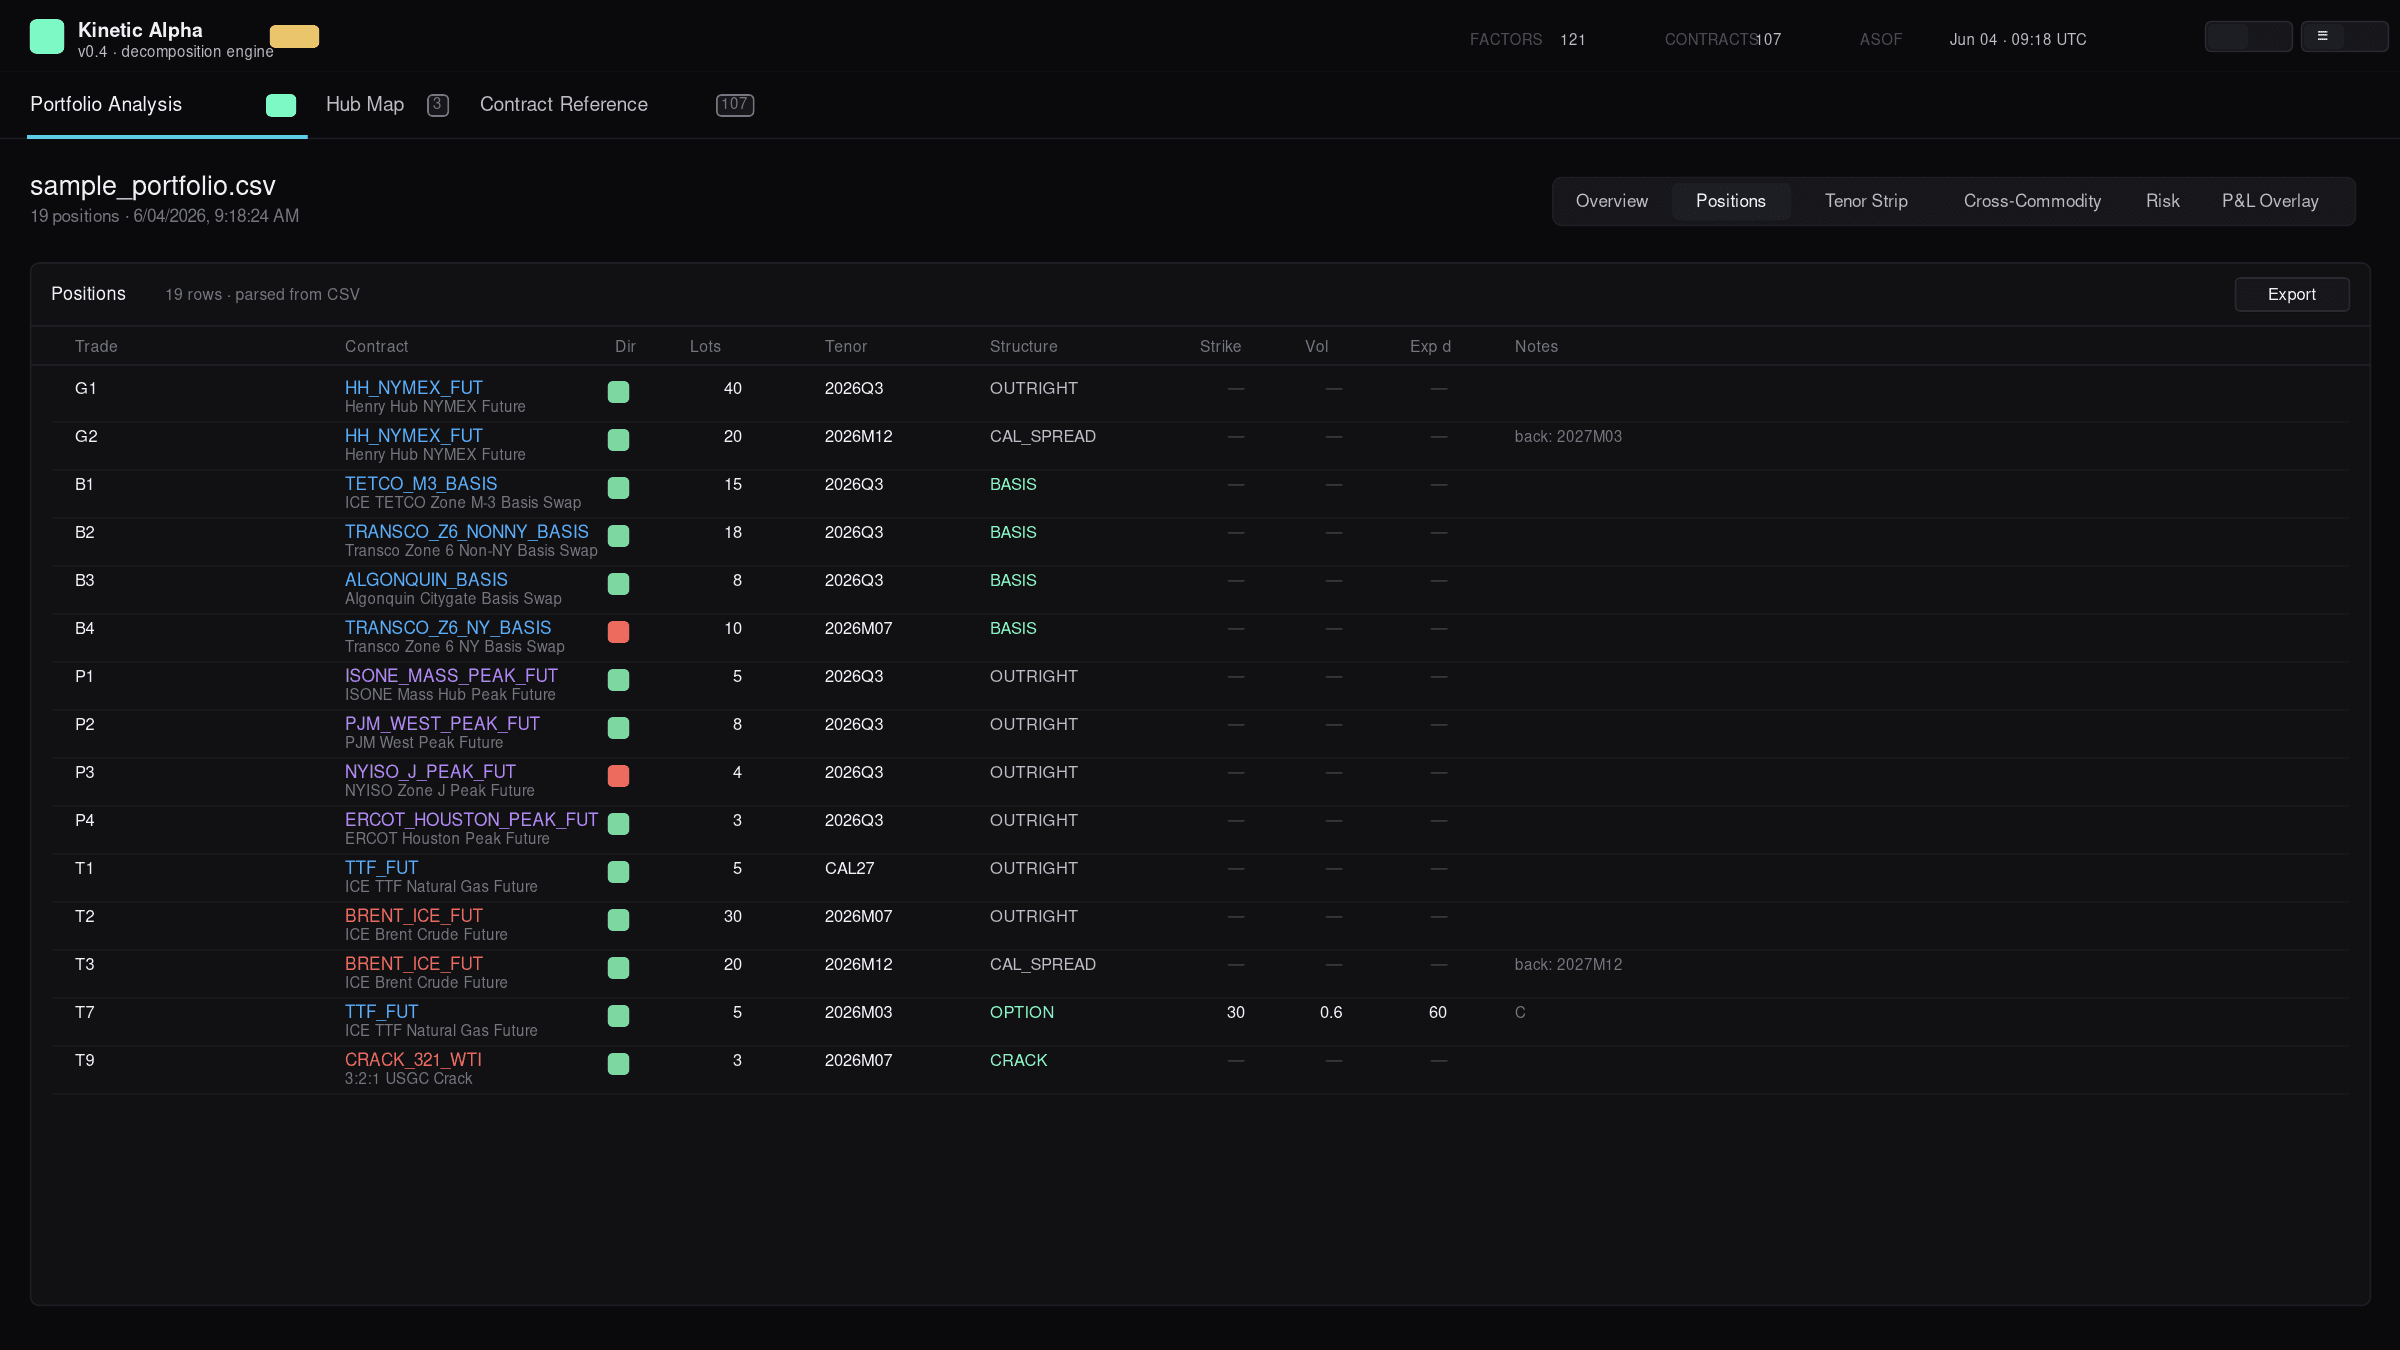
Positions — what's actually in the book
Sortable table of every parsed position with trade ID, contract code, direction (L/S), lots, tenor, structure, and metadata. The structure column now auto-detects basis swaps, cracks, options, and other multi-leg contract types rather than just labeling everything 'OUTRIGHT'.
Every basis swap shows BASIS, every crack shows CRACK, every option shows OPTION — at a glance you know which positions decompose into multiple factor legs vs. which are flat exposures.
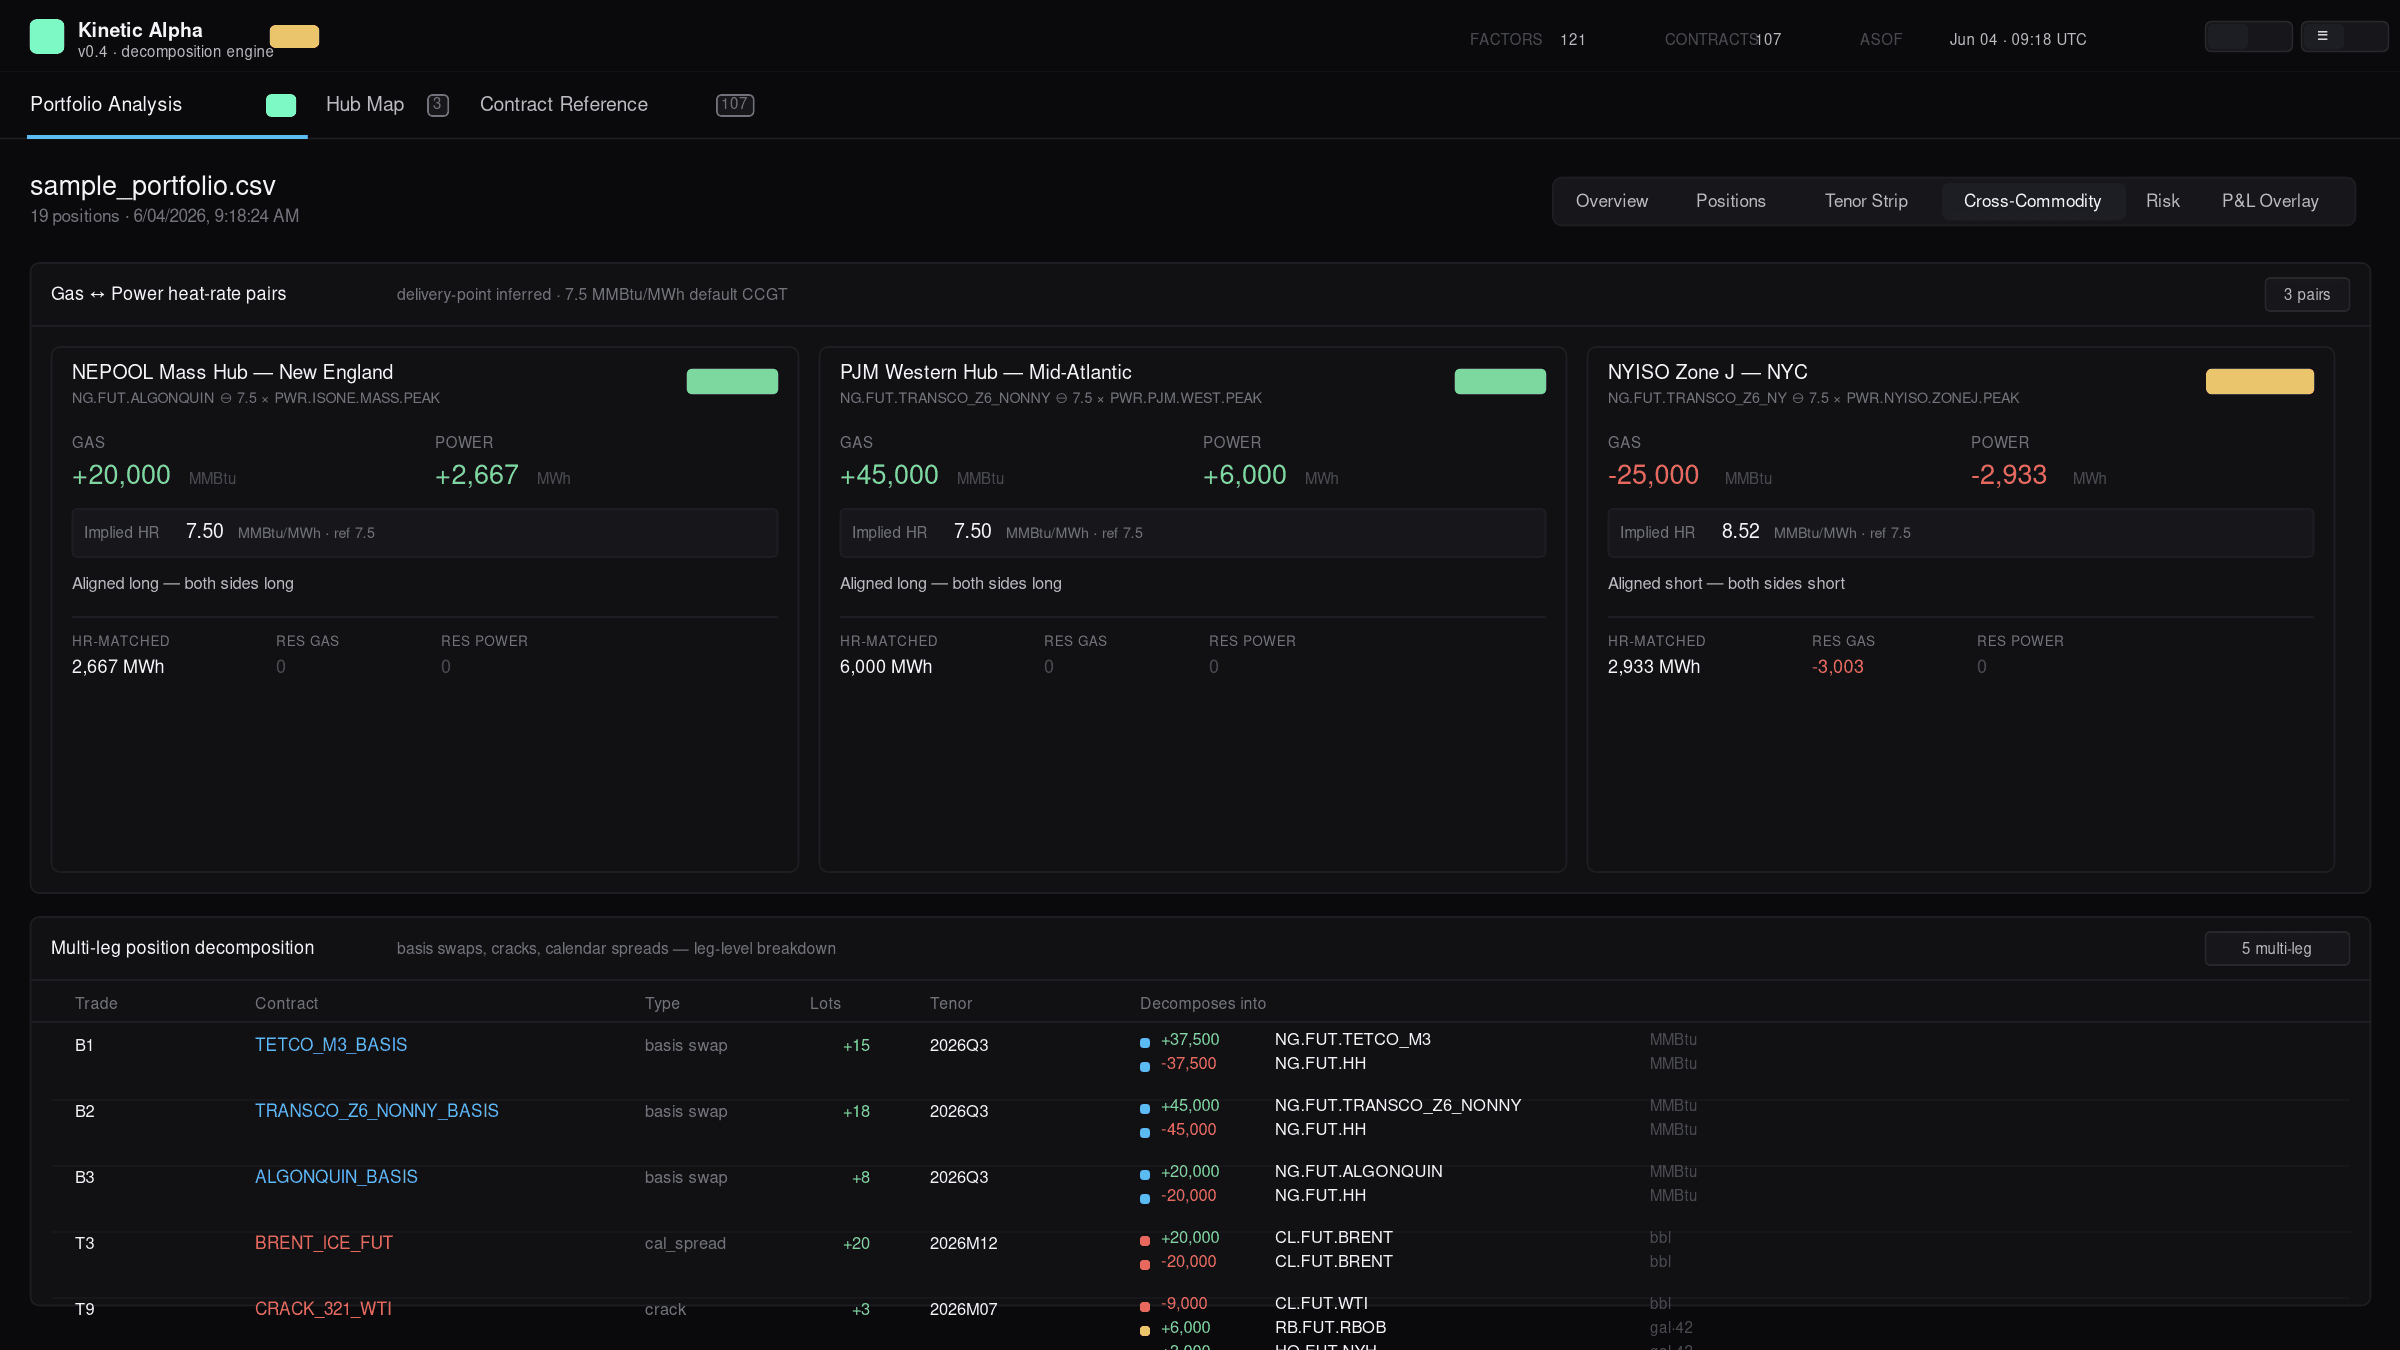
Cross-Commodity — heat-rate pairs + leg provenance
The engine looks at your portfolio and identifies implicit gas-to-power heat-rate exposures using a delivery-point lookup table (Algonquin→ISONE, Transco Z6 NY→NYISO J, TETCO M3→NYC, etc.). Each pair shows gas qty (MMBtu), power qty (MWh), implied heat rate vs. the 7.5 reference, spark-spread interpretation, and the residual after HR matching. Below the pairs: every basis swap, crack, and calendar spread broken into its constituent factor legs.
Drop a long Algonquin basis + long ISONE Mass Peak into the book and the engine tells you it's an aligned long at 7.5 HR — no manual matching, no spreadsheet. Same delivery geography a desk would reason through, automated.
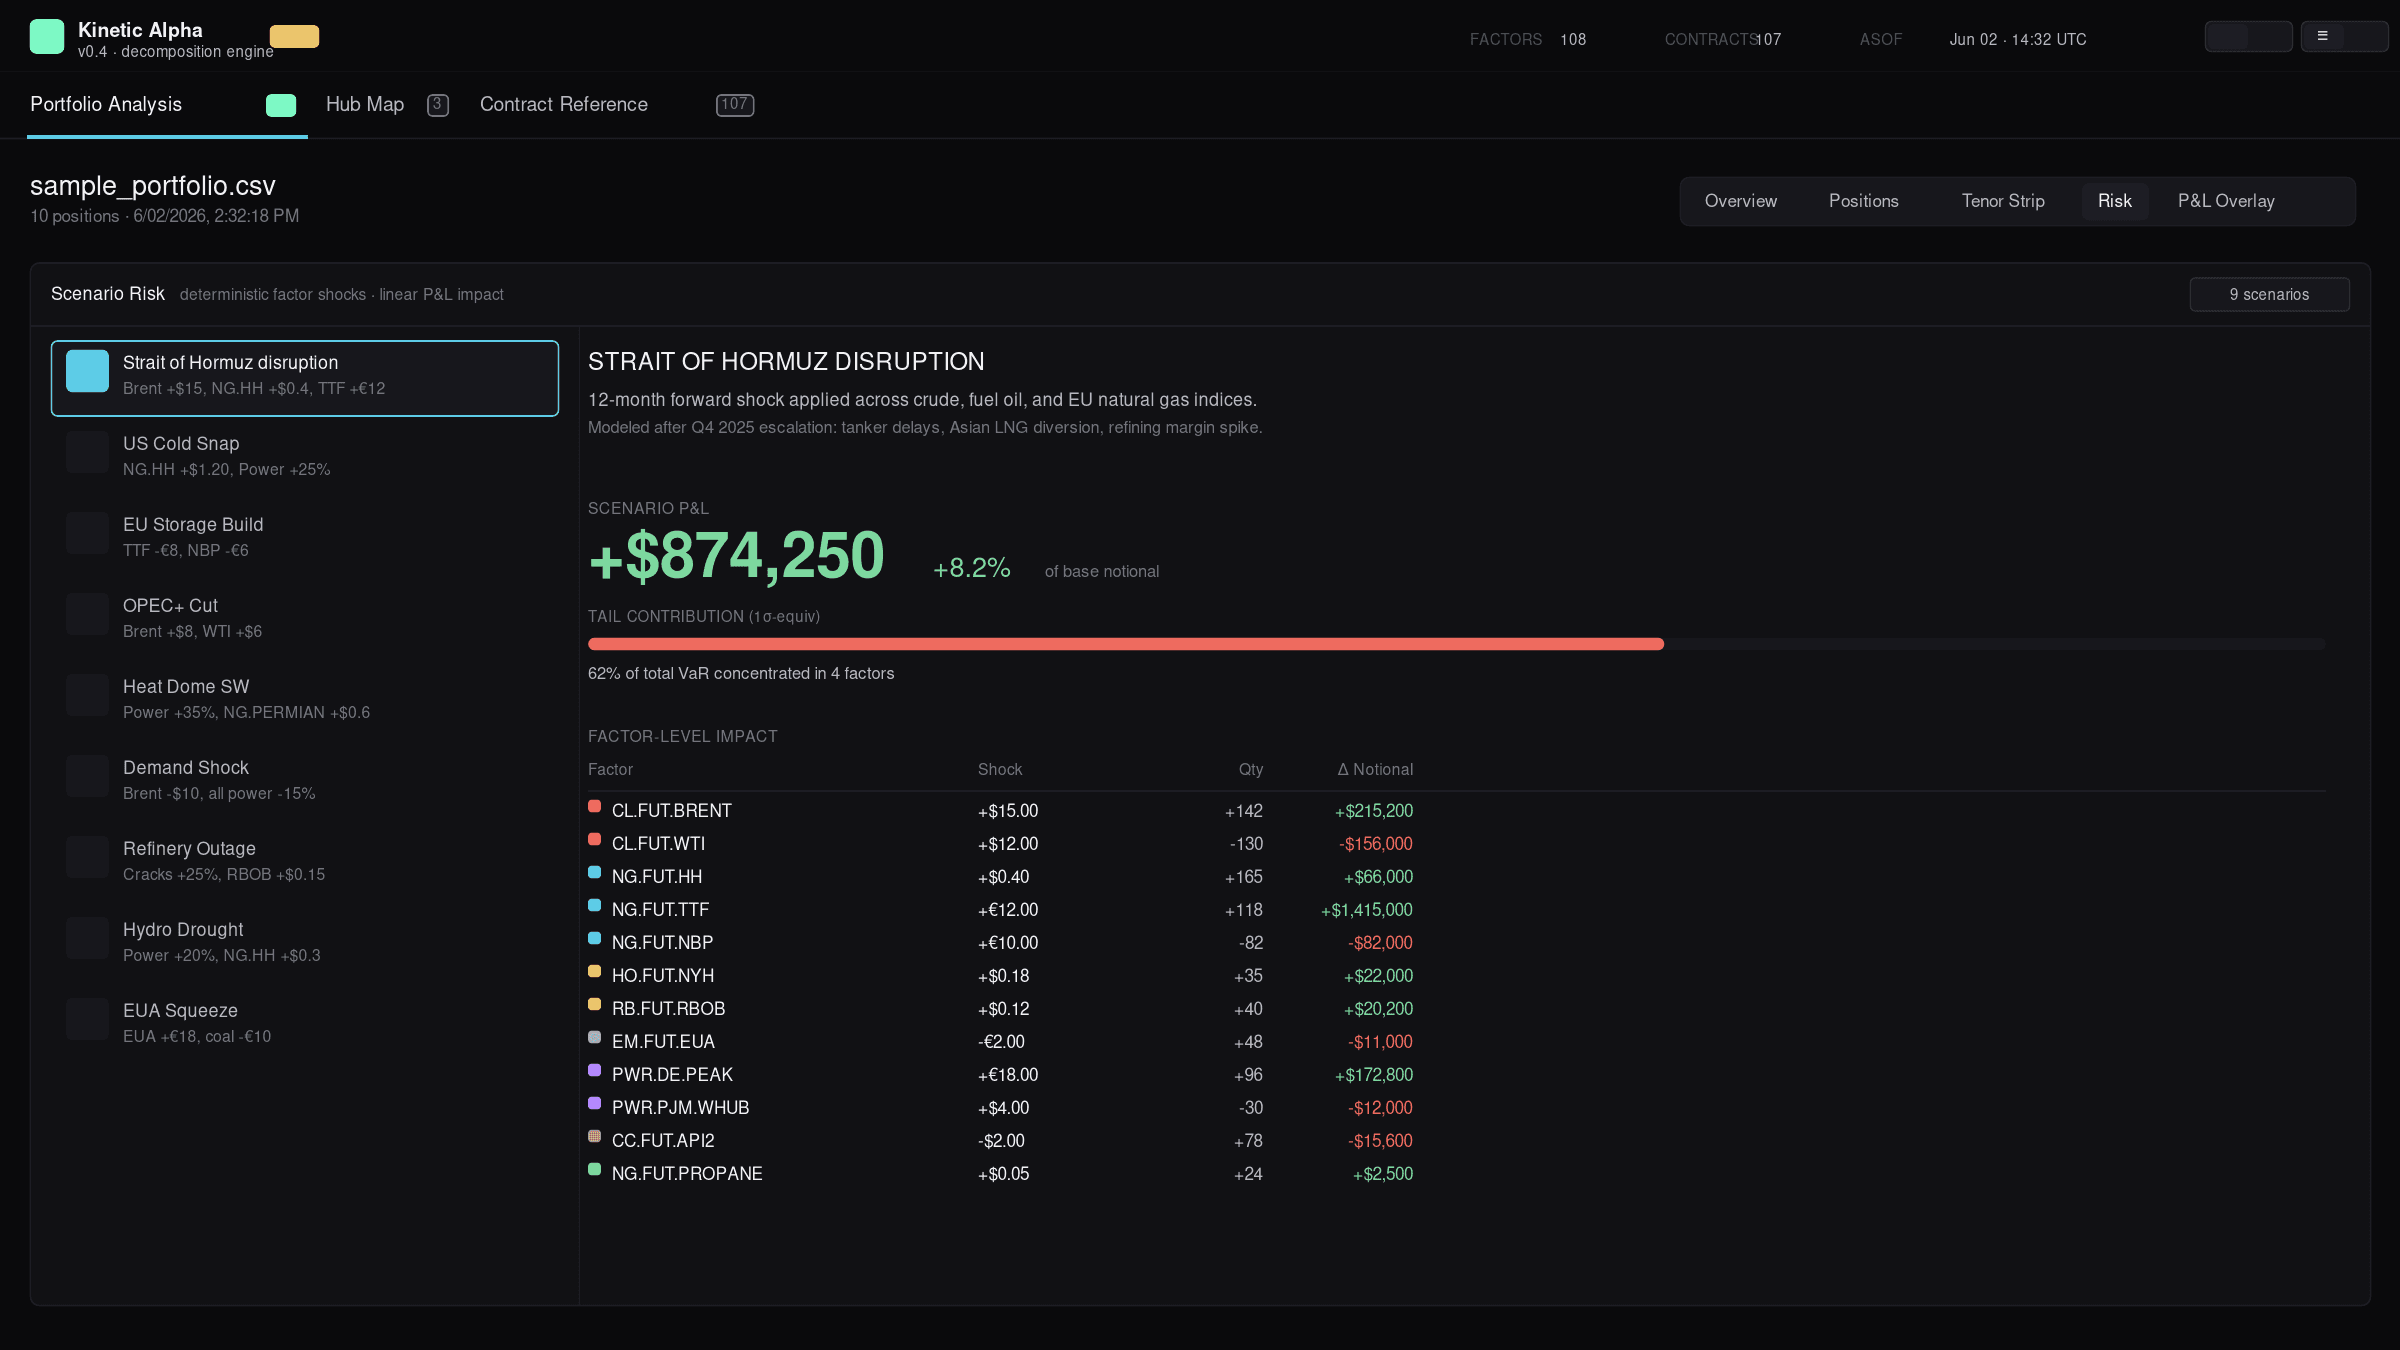
Risk — named macro scenarios
Pre-configured deterministic shocks for the scenarios that actually matter in energy markets — Strait of Hormuz disruption, US cold snap, EU storage build, OPEC+ cut, heat dome, refinery outage, hydro drought, EUA squeeze, demand shock. Each scenario applies factor-level shocks and returns scenario P&L plus a factor-by-factor contribution breakdown. Edit the shocks to run custom what-ifs.
Pick Hormuz, see exactly which factors are driving the +$874K scenario P&L and what shock magnitude each carries — instantly. The shock vectors are editable, so it's also the simplest way to roll your own scenario without building a spreadsheet.
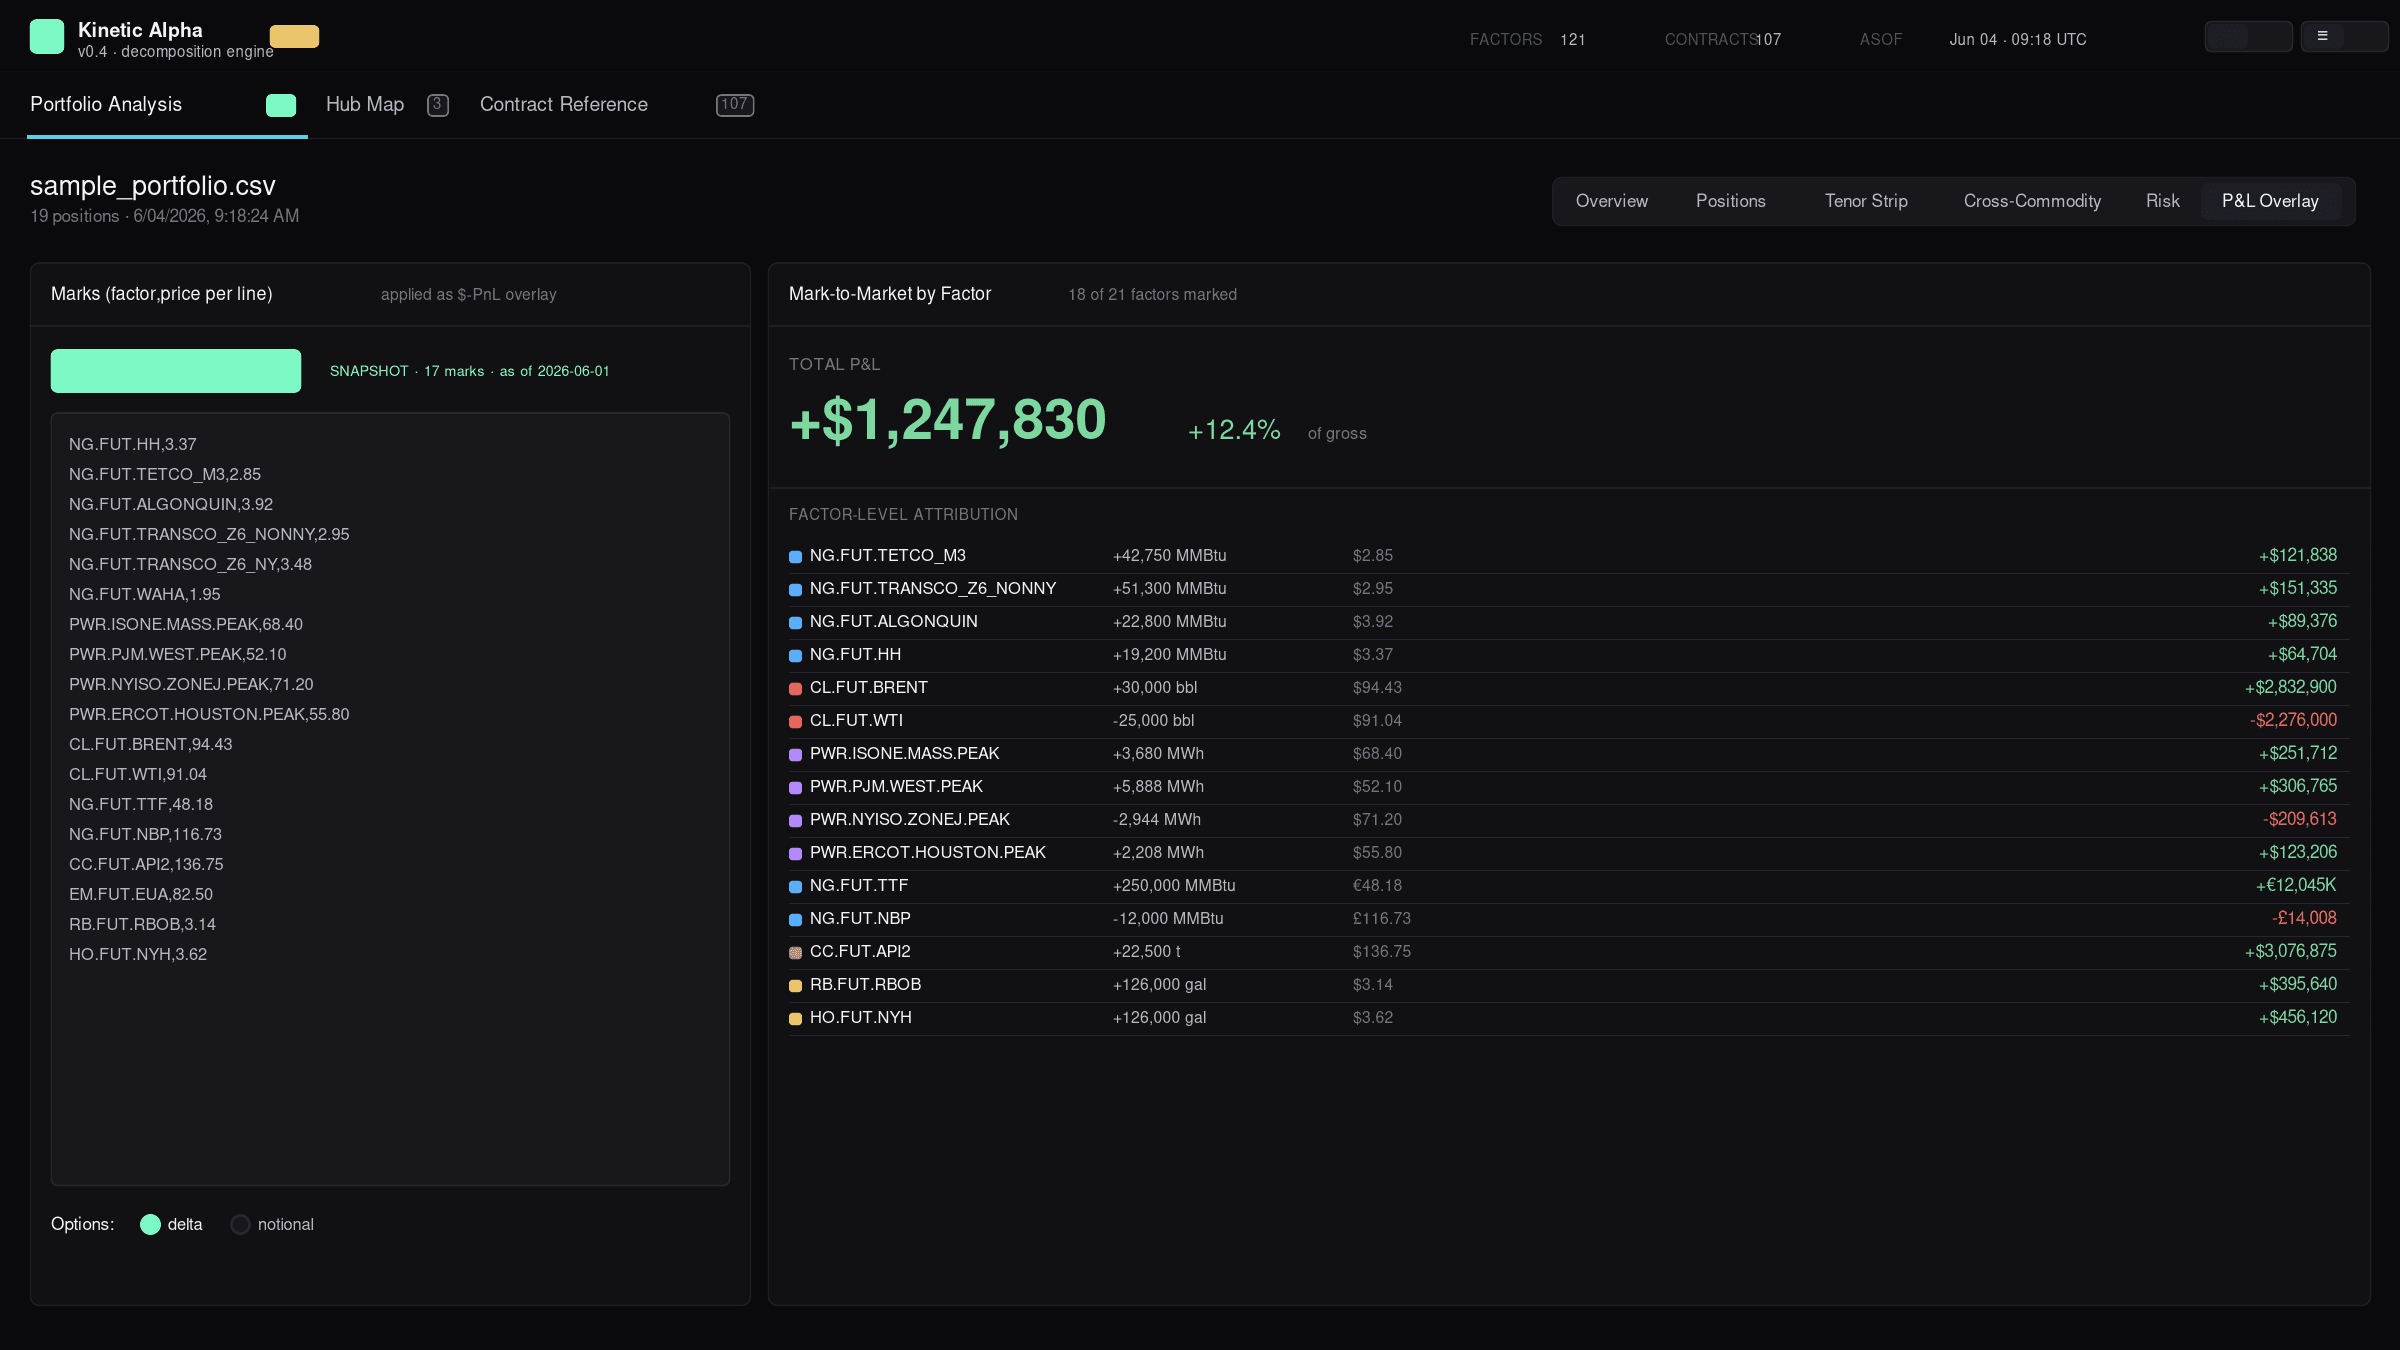
P&L Overlay — marks in, attribution out
Paste factor,price rows in the marks box or load the bundled market snapshot. The dashboard applies the marks to the net factor exposure and returns mark-to-market by factor plus a total. Switch options between delta and full-notional to see how option exposure rolls through. A snapshot loader pulls in a public-source EOD reference set with the as-of date displayed.
The same factor decomposition that drives the Overview and Risk tabs also drives this — paste marks once and the P&L attribution is consistent end-to-end across every view in the dashboard.
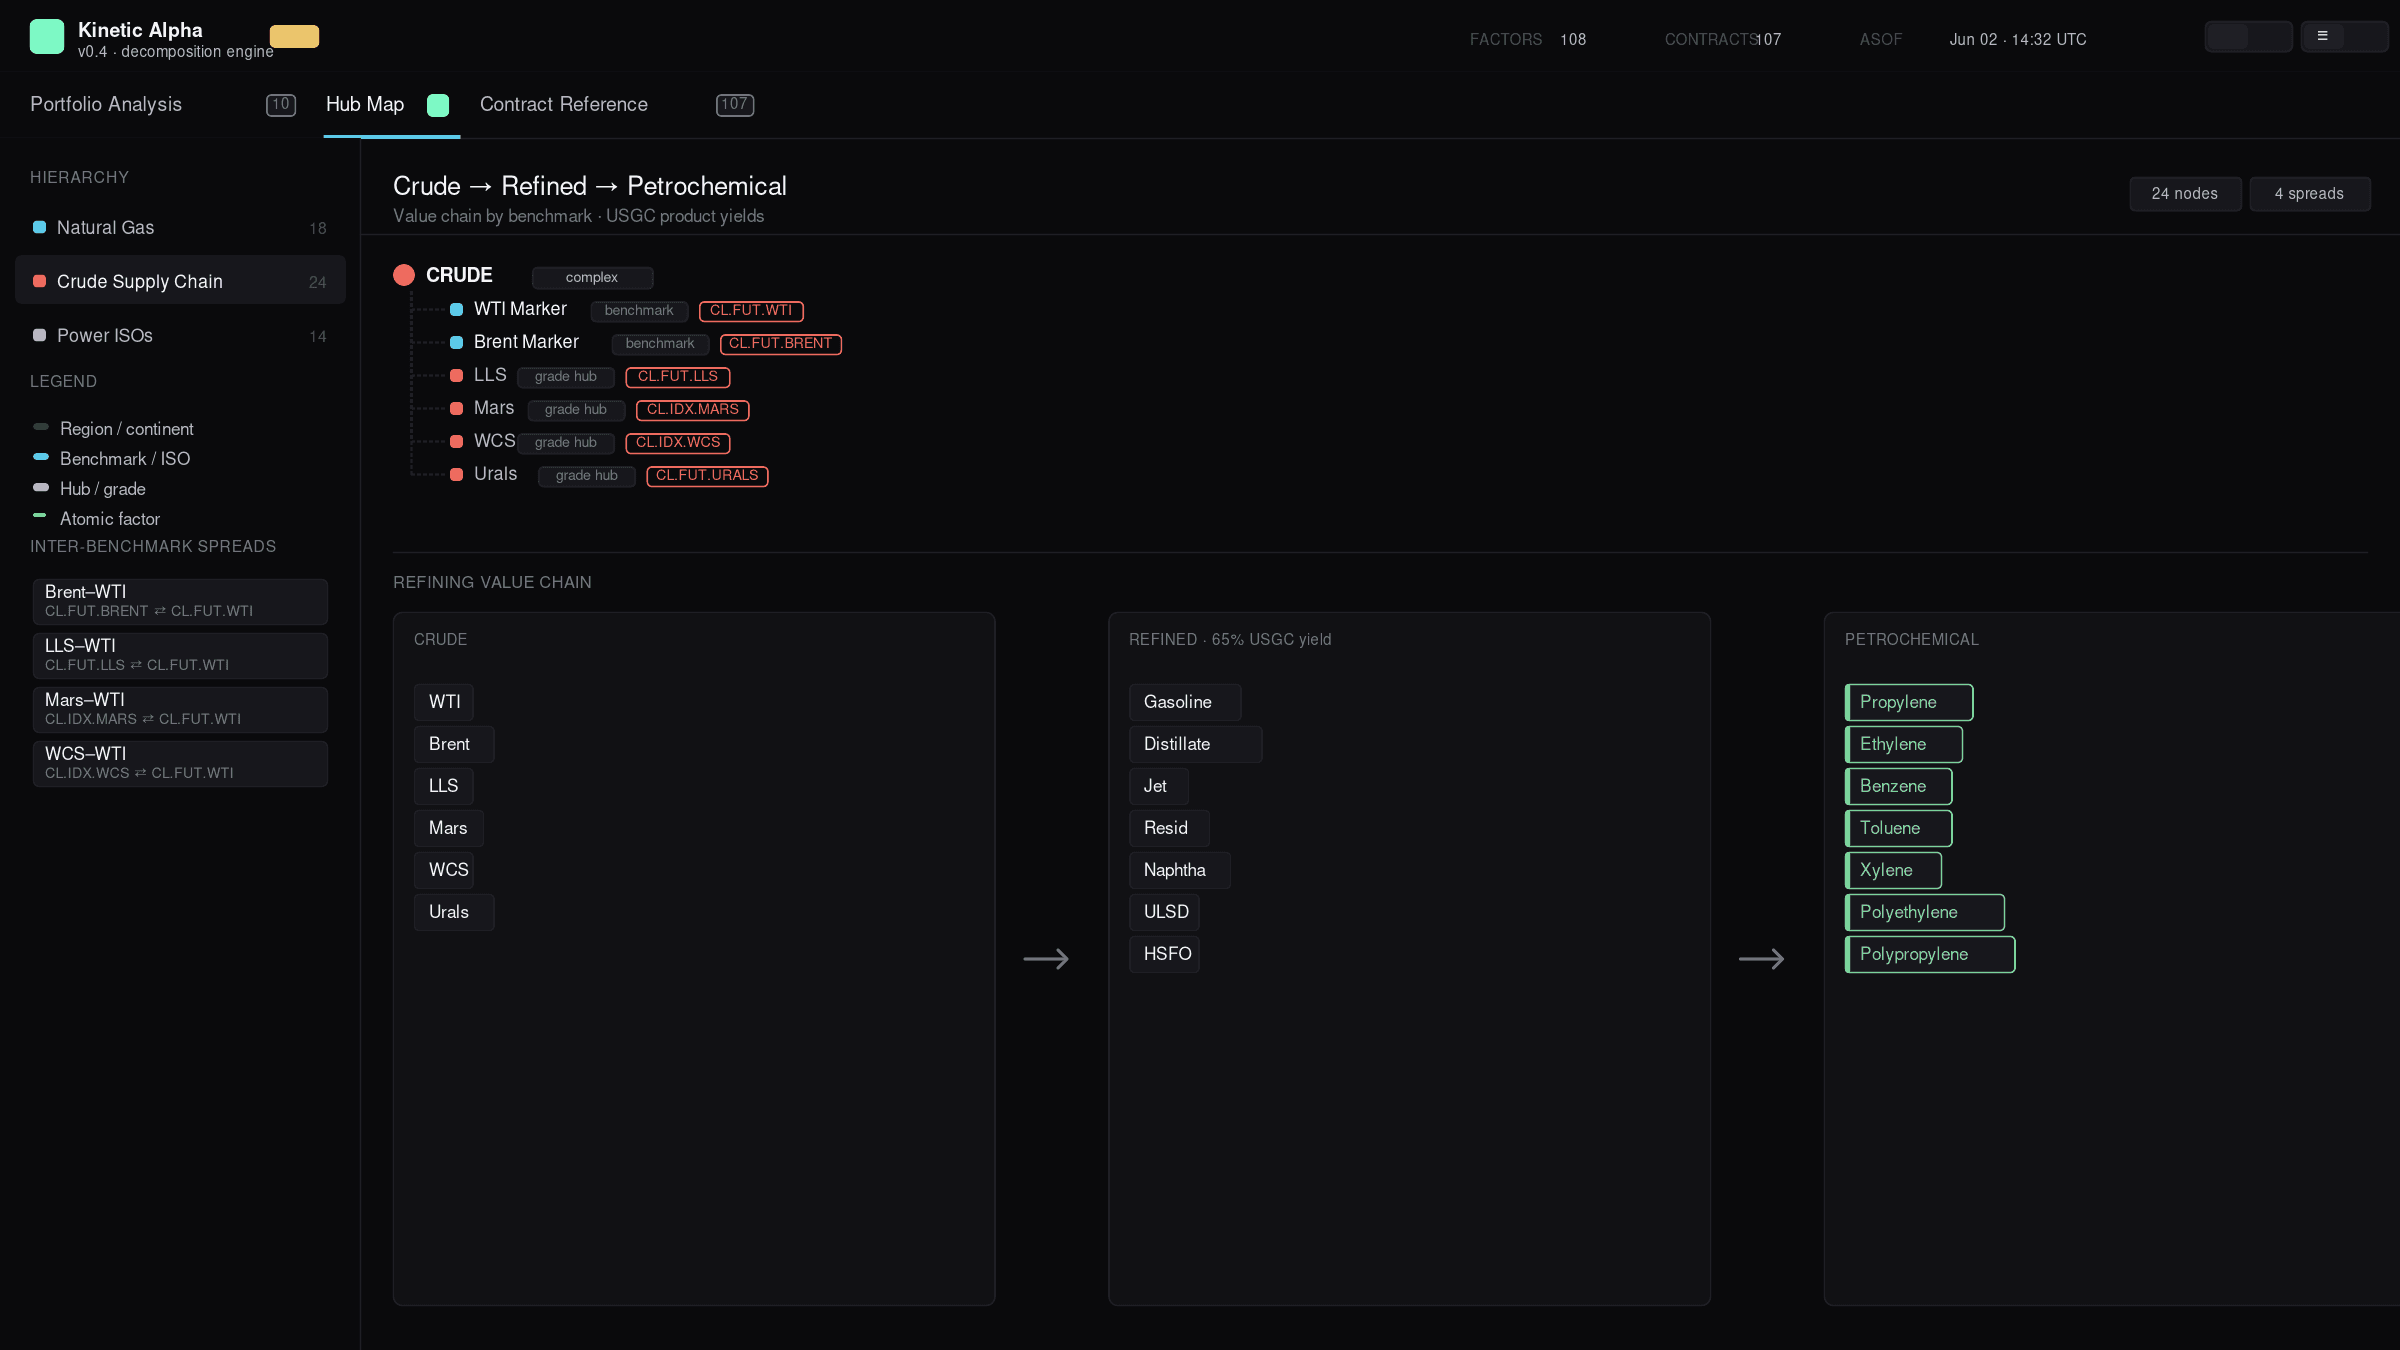
Hub Map — the geography behind the numbers
Three hierarchies, switchable from the sidebar: a natural gas hub tree (Henry Hub and the basis points around it — Transco, TETCO, Algonquin, Chicago, Waha; TTF/NBP/THE/PEG/PSV/ZTP for Europe); a crude → refined → petrochemical value chain showing WTI/Brent/LLS/Mars/WCS feeding USGC refining yields and downstream petchem; and a power ISO map (PJM, MISO, ERCOT, CAISO, NYISO, ISONE) with spark-spread relationships showing each ISO's typical heat rate and primary gas input.
The crude value chain is the cleanest single view of how a refining margin actually works — from input grade through 65% USGC yield to which petrochemical streams come off each cut.
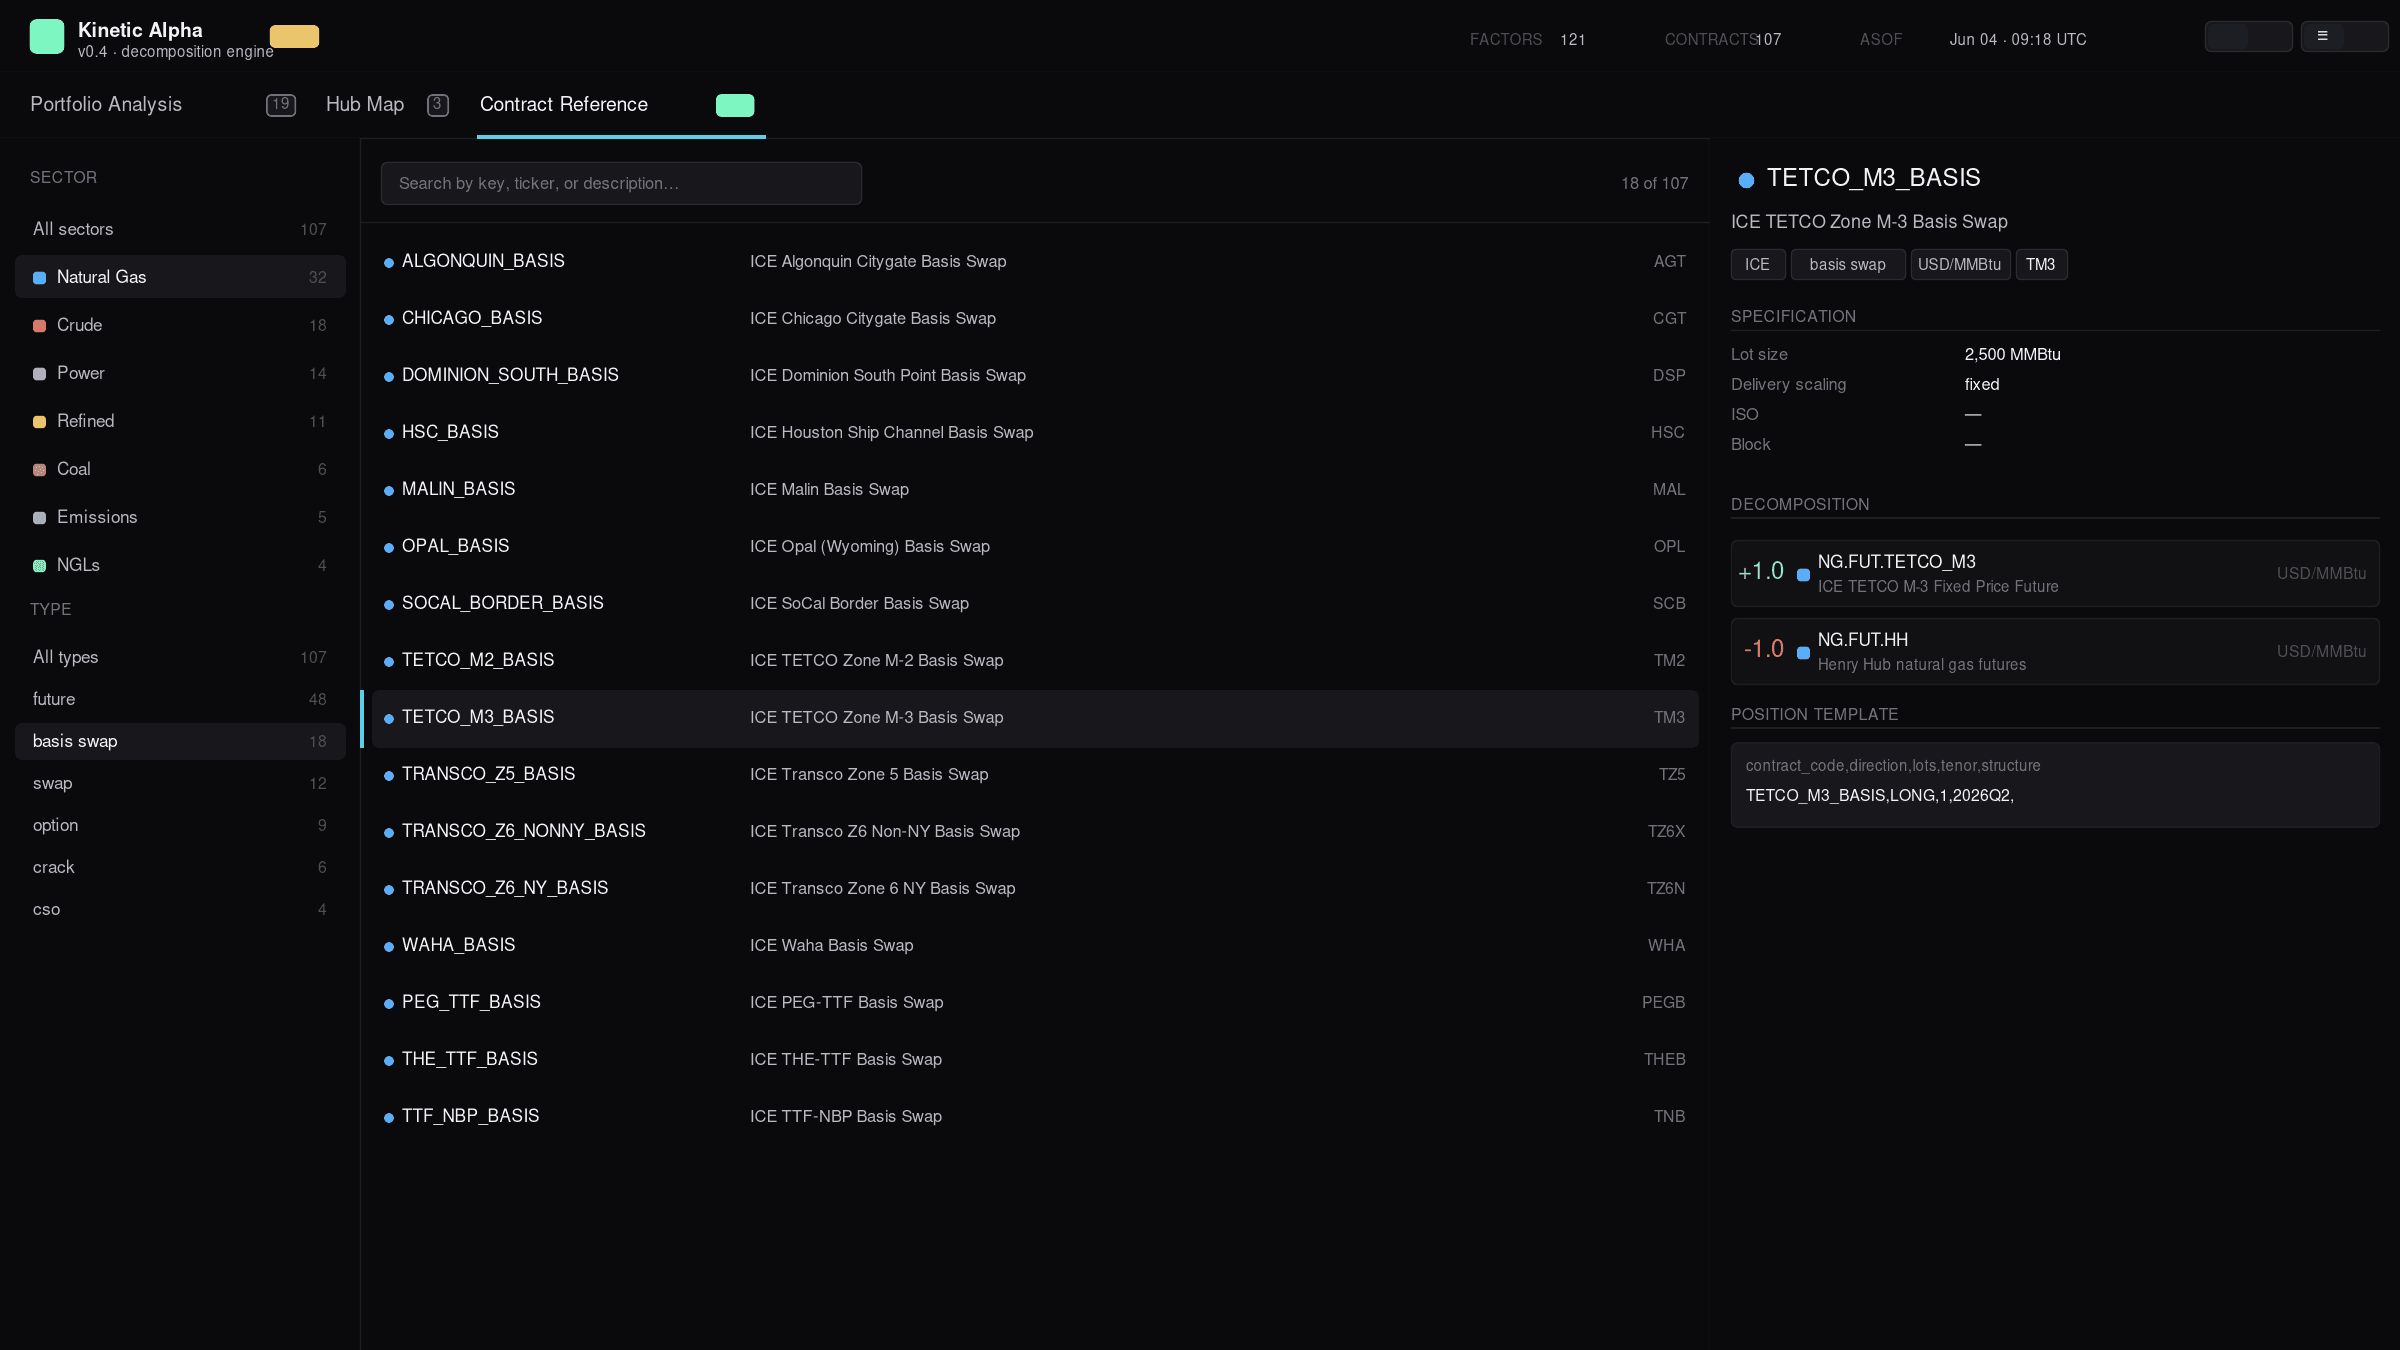
Contract Reference — every contract, every leg
Faceted browser for all 107 contracts. Filter by sector or by type (future, basis swap, swap, option, crack, CSO, spread), search by key or ticker or description, and click any contract to see its full decomposition — every leg with coefficient, factor code, factor description, unit, and ICE product code where verified.
Click any basis swap and see its two legs explicitly (e.g., TETCO M3 BASIS = +NG.FUT.TETCO_M3, −NG.FUT.HH) — the same decomposition the engine applies when you put the position in your portfolio.
The playbook
Five portfolios that teach the machine.
The Playbook tab ships five worked example portfolios, each chosen to exercise a different part of the decomposition engine — and each loadable into Portfolio Analysis with one click:
- Locational arbitrage — long the Waha discount, short the HSC premium, with the ERCOT West-vs-North power echo. Demonstrates basis-leg netting: both basis swaps carry Henry Hub legs that cancel automatically, leaving pure location risk.
- Term-structure arbitrage — gas winter/shoulder calendar spreads, a Brent Dec-Dec roll, and a TTF quarter-vs-strip. Nearly zero net factor exposure; the whole book lives in the tenor dimension, which only the per-month expansion can see.
- Crude / crack arbitrage — long 3:2:1 vs short 2:1:1 (a pure gasoline-vs-distillate tilt), plus sour-grade discounts and the Murban–Dubai quality spread. Demonstrates fractional coefficients and gal→bbl / mt→bbl unit conversion.
- Heat-rate arbitrage — a listed spark future, the same structure replicated manually from power + gas legs, and a winter/duck-curve pair. The cross-commodity matcher reconciles all three against the power↔gas association map.
- Diversified low-net / high-gross — seven economically-flat cross-venue pairs (NYMEX↔ICE Henry, WTI, Brent; ICE↔Nodal PJM; ICE↔CME basis). Net delta ≈ 0, but five clearing houses each demand full margin — the venue table makes the margin tax visible.
Each playbook includes the thesis, the position CSV, a step-by-step account of how the engine decomposes it, a tab-by-tab guide to reading the result, and what can go wrong.
Case study · New
Gross notional is not risk — ATLAS vs VECTOR.
To put the machine to work at institutional scale, the Playbook tab now ships two case-study portfolios built from the same five archetypes and analyzed side-by-side in a full research note. ATLAS is a $5.07B-gross book engineered from offsets — cross-venue pairs, calendar spreads, crack-vs-crack tilts, spark replications, basis pairs — that collapses to $133M of net directional exposure (2.6%). VECTOR is a $2.66B-gross conviction book carrying $866M net (32.5%). Same instruments, same liquidity standard (≥97% of gross in liquid tiers on both).
The result: the book with 1.9× the gross notional loses 8× less in its worst stress scenario (−$12.6M vs −$102M) — yet posts twice the initial margin ($465M vs $228M across five clearing houses), because CCPs margin positions, not economics. Exposure in energy is a function of net, not gross; but the market prices gross anyway. The full analysis — decomposition mechanics, sector nets, tenor structure, heat-rate matching, scenario grid, and the margin table — is in the PDF.
Under the hood
Architecture and verification.
The engine and its browser counterpart share their interface: 430+ factors, 470+ contracts, nine contract structures (OUTRIGHT, STRIP, CAL_SPREAD, OPTION, CSO, plus basis, cracks, heat-rate futures, and spreads). Each contract maps to a weighted sum of factors; positions expand through the structure handler into dated monthly legs scaled by the contract's unit conventions. Contracts that represent economically equivalent exposure across exchanges (e.g., NYMEX HH ↔ ICE HH LD1, NYMEX WTI ↔ ICE WTI) keep distinct factor codes so inter-exchange basis surfaces explicitly in the cross-exchange offset view rather than silently netting.
- Power MW→MWh. A NERC- and EU-aware calendar counts on-peak / off-peak / base hours per delivery month — verified against independent sources (PJM peak July'26 = 368h, Christmas-Friday correctly drops a peak day, peak + off-peak ties to total).
- Options. Black-76 delta for bullet options on positive forwards;
delta_overridefor non-standard structures including CSOs. - Strips and spreads. Calendar strips (
CAL27,2026Q3,WIN26, custom ranges) expand to monthly legs; calendar spreads net the front and back tenors. - Cracks. 3:2:1, 5:3:2, and other refining cracks decompose into their crude / gasoline / distillate constituents with industry-standard ratios.
Parity testing. The Python reference engine and the JavaScript browser engine are checked cell-for-cell — 32/32 (factor, month) cells match exactly on the full reference portfolio. Phase 1 tests: 24/24. Phase 2 tests: 23/23. The dashboard is not a separate, drift-prone reimplementation; it shares the same logic that's checked against the source. The v3 data layer adds its own integrity gate: every decomposition leg must reference an existing factor, every hierarchy child an existing node, and every playbook CSV must parse and expand without error before the build ships.
Two defects the v3 verification pass caught and fixed. First, the v2 data merge dropped the NERC/EU delivery calendar, so MW→MWh block-hour scaling could fail for power positions. Second, Nodal zone contracts were authored with a delivery-scaling alias the engine didn't recognize, silently understating every Nodal MW position by the month's block-hour count (~350×). Both are corrected in the v3 merge — power exposures now scale correctly across ICE, CME, and Nodal venues.
Limitations & caveats
What this dashboard is not — read before drawing conclusions.
This is a research and education tool. It is not investment advice, not a trading system, and not a settlement-grade risk system. Concretely:
- The seed portfolios are illustrative, not real positions. They exist to demonstrate the decomposition and to give you something to drive the UI with on first load.
- $-PnL requires user-provided marks. There is no live ICE/EEX/NYMEX price feed wired in — pasted marks are the source of truth for any P&L number you see.
- Open interest and volume are a snapshot, not a feed. Figures are as of June 30, 2026, sourced from CFTC Commitments of Traders (June 9 positions), ICE/CME/Nodal press releases, and — where marked with an asterisk or "est." — order-of-magnitude estimates anchored to the latest verified data. Thin hubs below the CFTC 20-trader reporting threshold show tier only.
- Some ICE product codes are flagged unverified. In the Contract Reference tab, a small number of contracts show an UNVERIFIED chip — those are best-effort mappings I've been unable to confirm against ICE's product master. Treat the verified-flagged codes as load-bearing; treat the unverified ones as placeholders.
- Black-76 assumes positive forwards. Calendar spread options (CSO) and basis options where the underlying can go negative require a normal/Bachelier model — currently those positions use
delta_overrideas a workaround. Don't rely on the Black-76 delta for those structures. - Power calendars cover US (5×16) and EU (5×12 peak / 7×24 base) conventions. Other regional conventions (UK 7-day with bank-holiday handling, Nordic, Iberia variants) need explicit configuration.
- Crack ratios use industry-standard conversion factors. 3:2:1, 5:3:2, etc. follow USGC convention. Verify against your firm's spec before applying to a real book.
- Persistence is browser-local only. Portfolios and preferences are saved in
localStorage— no cloud sync, no server backup. Clearing site data deletes your portfolios. Don't use this as a system of record. - Scenario shocks are deterministic factor moves, not Monte-Carlo. The Risk panel applies named factor-level shocks and reports the linear P&L impact; it doesn't propagate correlated tails or run distributional VaR.
- Margin and clearing logic is out of scope. The dashboard returns exposures and P&L; it does not compute SPAN, VaR-based margin, or ICE's actual margin algorithm. Don't use these outputs to anticipate margin calls.
On deck
What's next.
The roadmap that keeps this useful as it grows:
- Live market data integration. v3 ships an embedded OI/volume snapshot (as of June 30, 2026); the next step is a refresh pipeline off the exchanges' daily volume-and-OI files, then a feed-driven mark layer for P&L.
- Verified ICE product codes. Close the gap on the unverified-flag set against ICE's product master.
- Normal-model option pricing. Replace the Black-76 /
delta_overrideworkaround with a proper Bachelier model for CSOs and basis options. - Server-side persistence (optional). A save-portfolio endpoint with auth, so portfolios survive a browser clear and can be shared across devices.
- Additional regional conventions. UK power with bank-holiday handling, Nordic system price, Iberia, Japan JEPX.
- Export. One-click PDF / Excel of any tab's state so analyses can be circulated outside the browser.
All artifacts — the ATLAS vs VECTOR analysis, dashboard guide, portfolio CSVs, reference table (also as markdown), and the full project zip — are in the downloads strip at the top of this page.
Daniel Kaufman · Kinetic Alpha. Code and methodology are shared for research and education. No warranty is made as to fitness for any particular use; not investment advice; not a trading system. Contact for collaboration: dkaufmanrisk@gmail.com.