Prediction markets · Portfolio margin · Perps × Predictive
From margin framework to cross-asset analytics.
Prediction-market portfolios sit awkwardly inside conventional margin engines — payoffs are binary, contracts correlate through systematic factors that don't map cleanly to delta exposure, and a position you'd call a hedge on paper can leave threshold-divergence basis risk uncovered.
With CFTC-regulated bitcoin perpetual futures now live on Kalshi (May 29, 2026), a new question opens up: how does a perp's linear delta interact with a strip of Kalshi binary contracts on the same underlying? The dashboard below models that explicitly for two assets (BTC + SPX), and the second tab carries forward the 8-cluster portfolio margin framework that preceded this work.
Tour the four views first (illustrated below — sticky feature index at the top jumps you to anything that looks interesting), then drive the live dashboard further down the page.
The features, illustrated
What the dashboard does — view by view.
Feature index
Click a feature to jump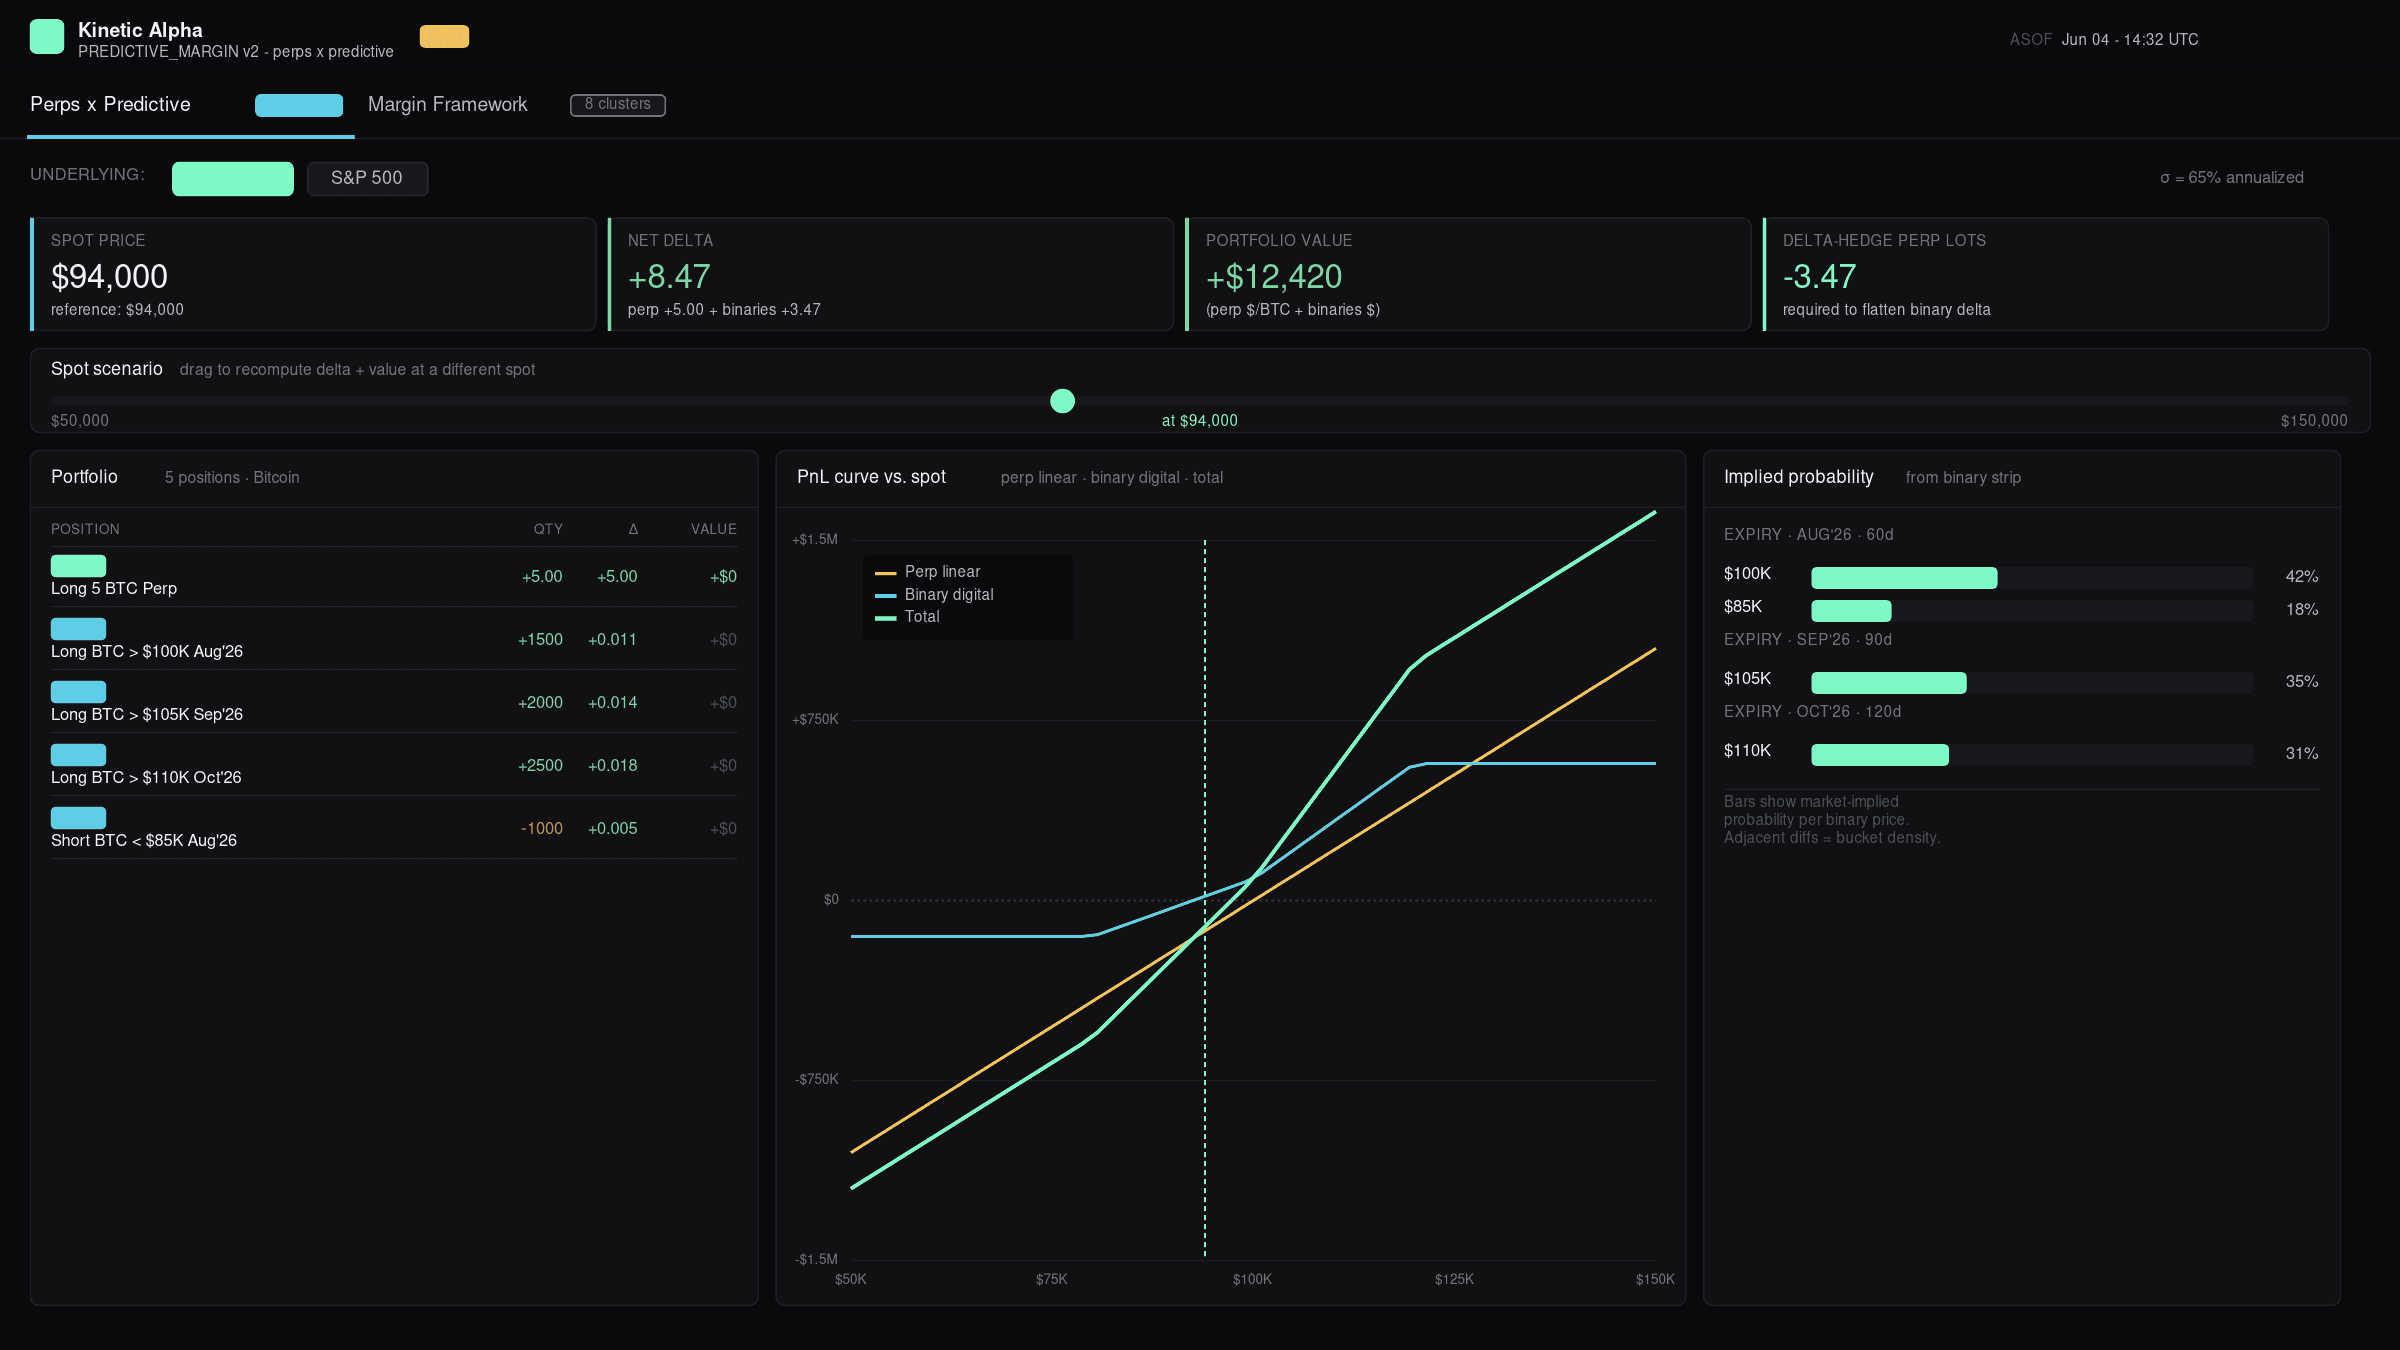
BTC perp + Kalshi binary strip — the canonical example
A long BTC perp position lives alongside a strip of Kalshi binary calls at upside strikes (`BTC > $100K Aug'26`, `BTC > $105K Sep'26`, `BTC > $110K Oct'26`) plus a short downside binary. The dashboard shows the four KPIs that define this position (spot, net delta, portfolio value, delta-hedge perp lots), a spot slider to scan across $50K–$150K, a positions table broken out by leg, a three-line PnL curve, and the implied probability backed out of each binary's price.
The delta-hedge perp lots KPI tells you exactly how many perp lots would flatten the binary book's delta at the current spot. The perp's role isn't speculative here — it's a continuous delta tool against a fundamentally step-shaped binary book.
SPX perp + binary strip — asymmetric, equity flavor
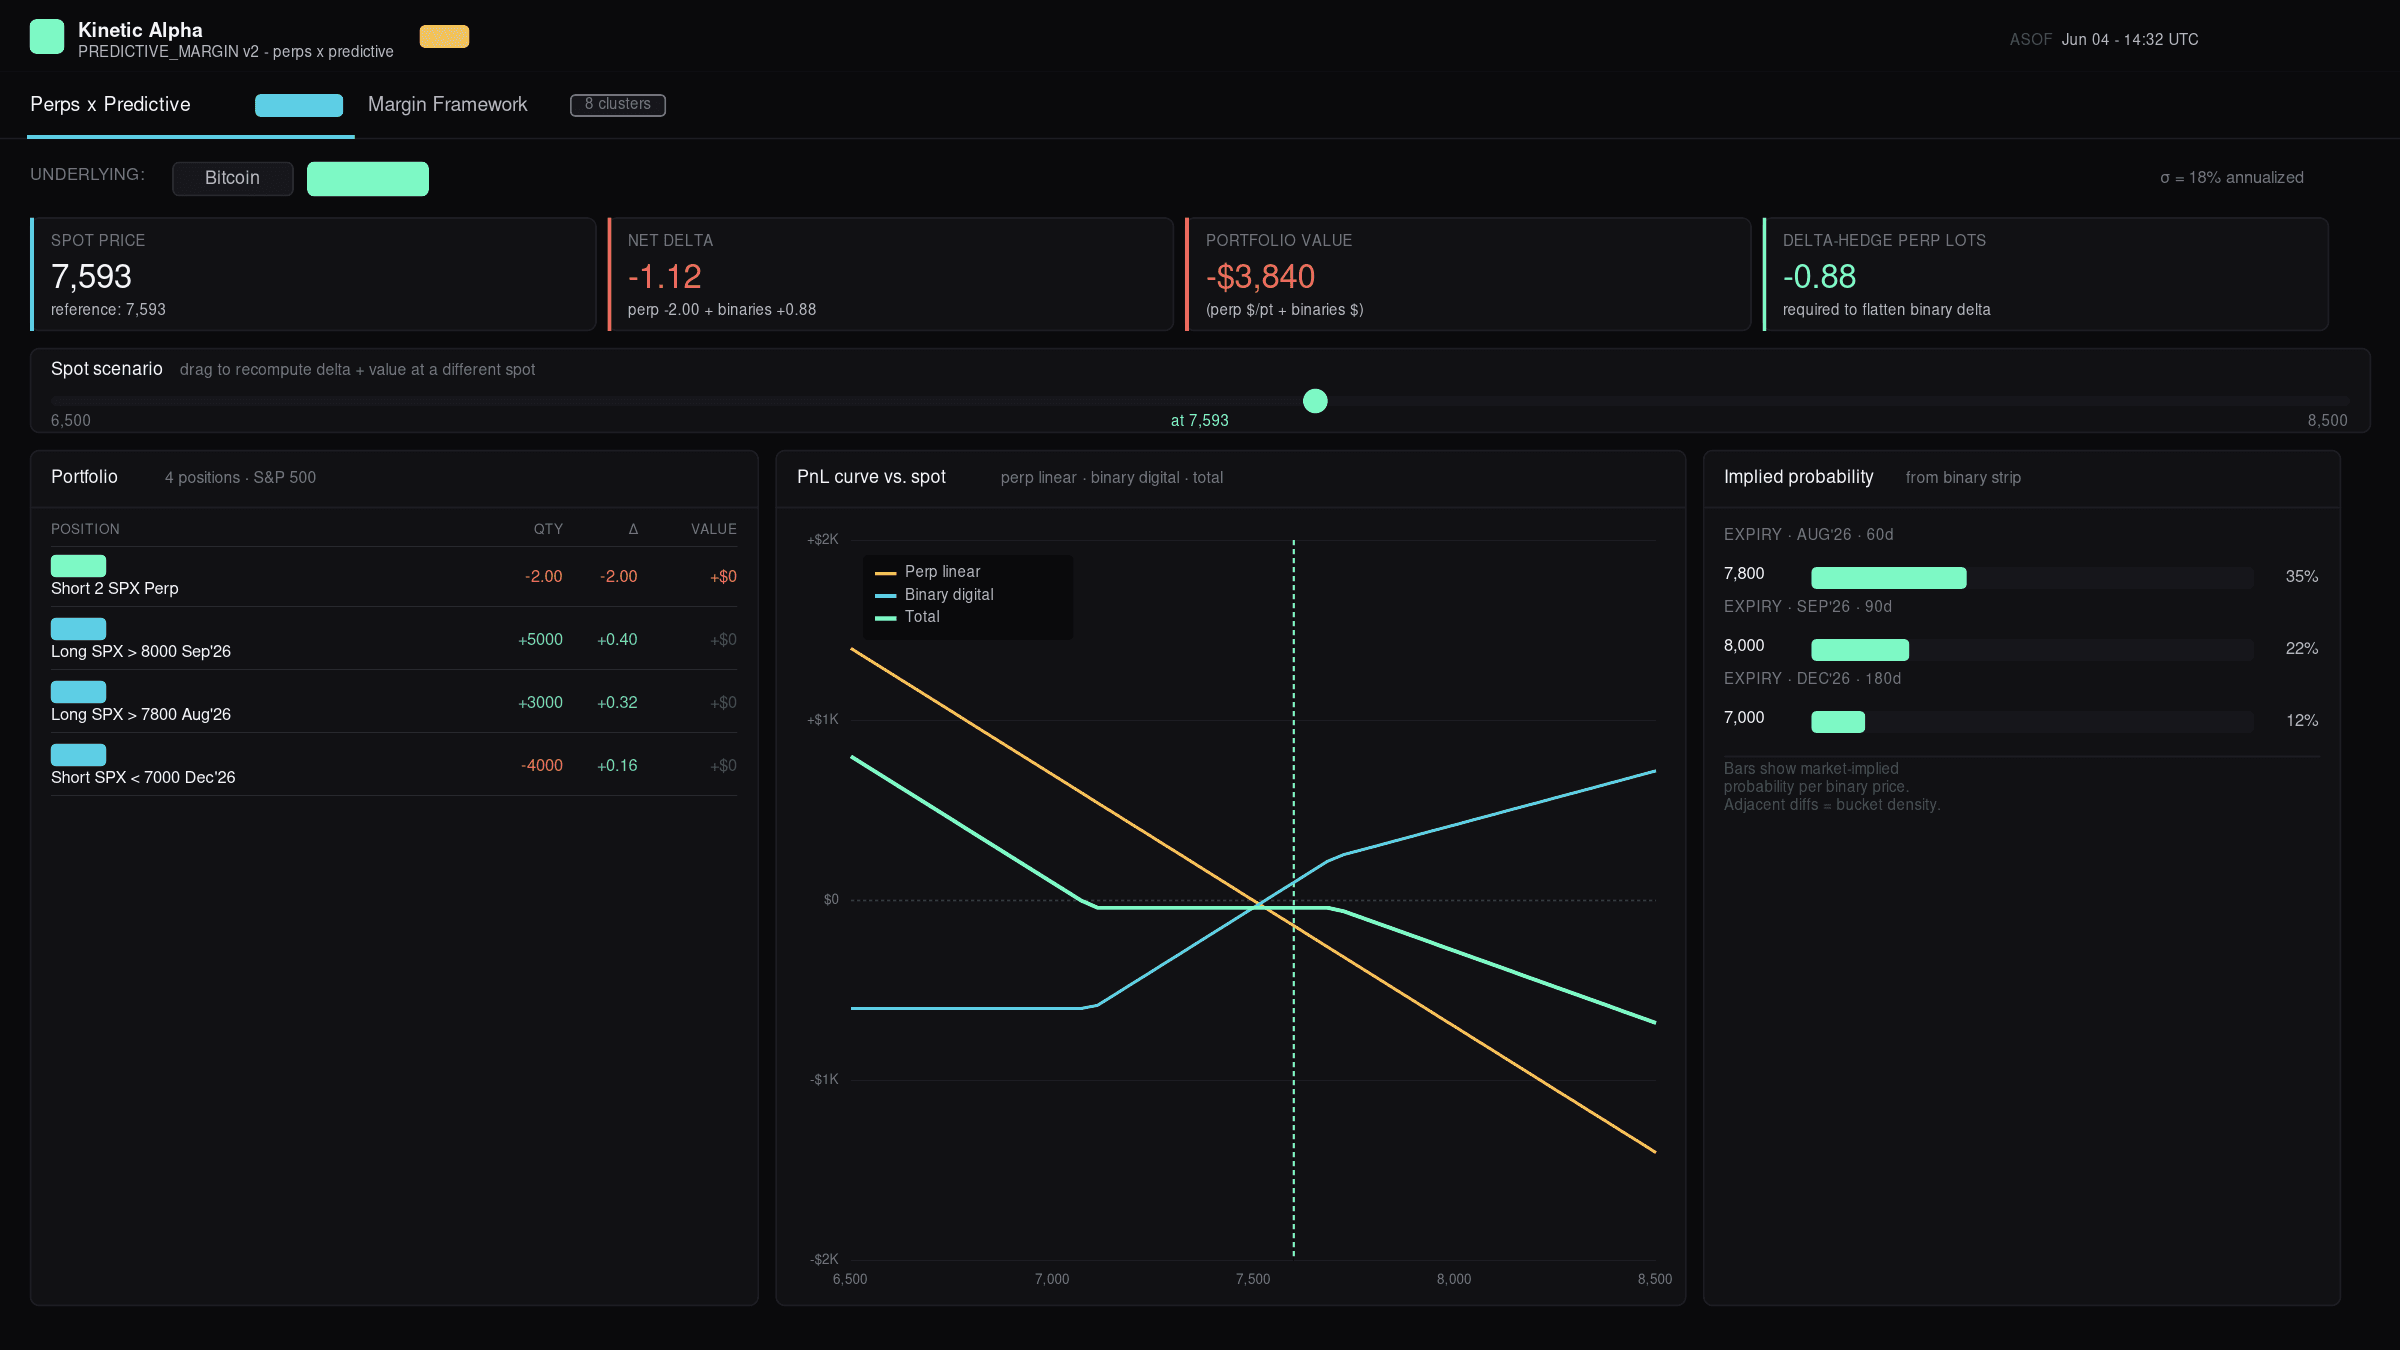
Switch the asset selector to SPX and the same analytics re-anchor on equity vol (σ ≈ 18% vs. BTC's 65%). The sample portfolio is intentionally asymmetric: short 2 SPX perps + long upside binaries (`SPX > 7,800`, `SPX > 8,000`) + short downside binary (`SPX < 7,000`). The total PnL line bends into a U-shape — short perp loses money in the upside tail but the long binaries clip the loss; the upside binaries' digital payoffs combined with the short perp create exposure that profits in the downside tail too.
The U-shape on the total line is a structural insight: short perp + long upside binaries on the same underlying produces something that *looks* directional but actually profits in both tails relative to the centered loss. That kind of asymmetric exposure is hard to see in a spreadsheet — trivial to see in this view.
Implied vol surface + live Kalshi markets
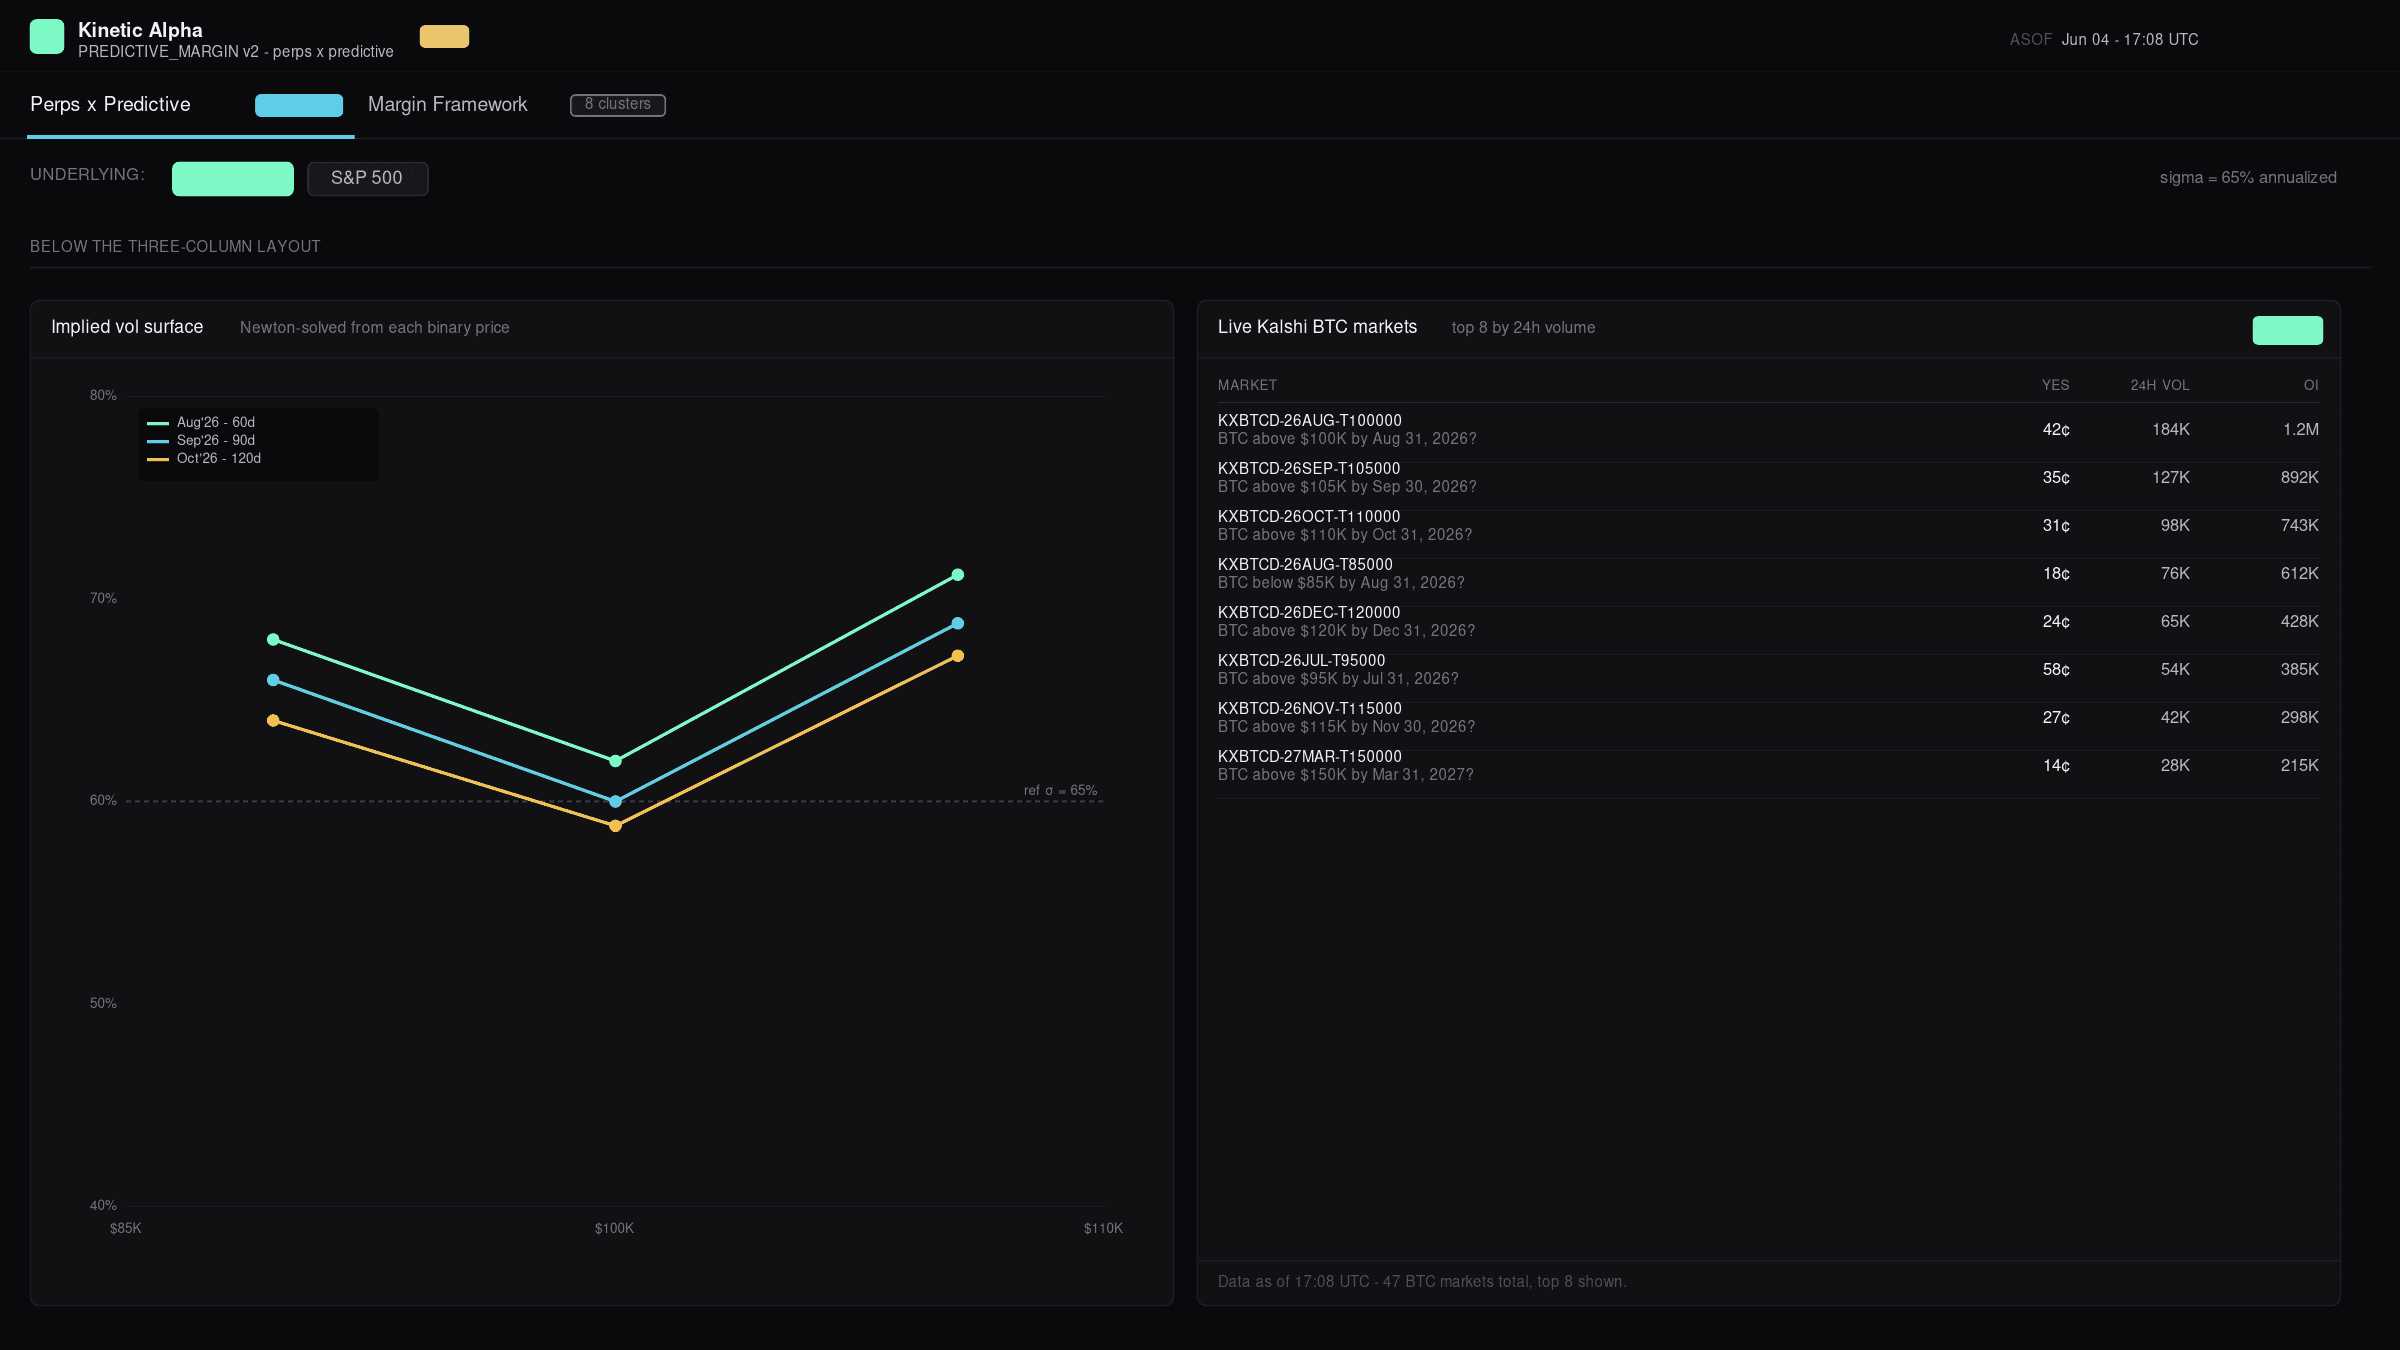
Below the main 3-column layout, two side-by-side panels surface the deeper market structure. The left panel is a Newton-solved implied-vol smile — one curve per expiry — showing where each binary's implied vol sits versus the reference σ. The right panel is a live Kalshi BTC markets feed: a server route at `/api/kalshi/btc-markets` proxies the public Kalshi API, filters to BTC tickers, sorts by 24-hour volume, and surfaces the top 8 with their yes-price, volume, and open interest.
Newton-Raphson with a bisection fallback recovers vol from any digital price where vega has the right sign — including the far-OTM cases where naive root-finding diverges. The Kalshi panel is wired through a 5-minute-cached server route, so the BTC binary strip you see in the sample portfolio can be replaced one-for-one with whatever's actually live on the venue right now.
8-cluster margin framework — interactive Monte-Carlo
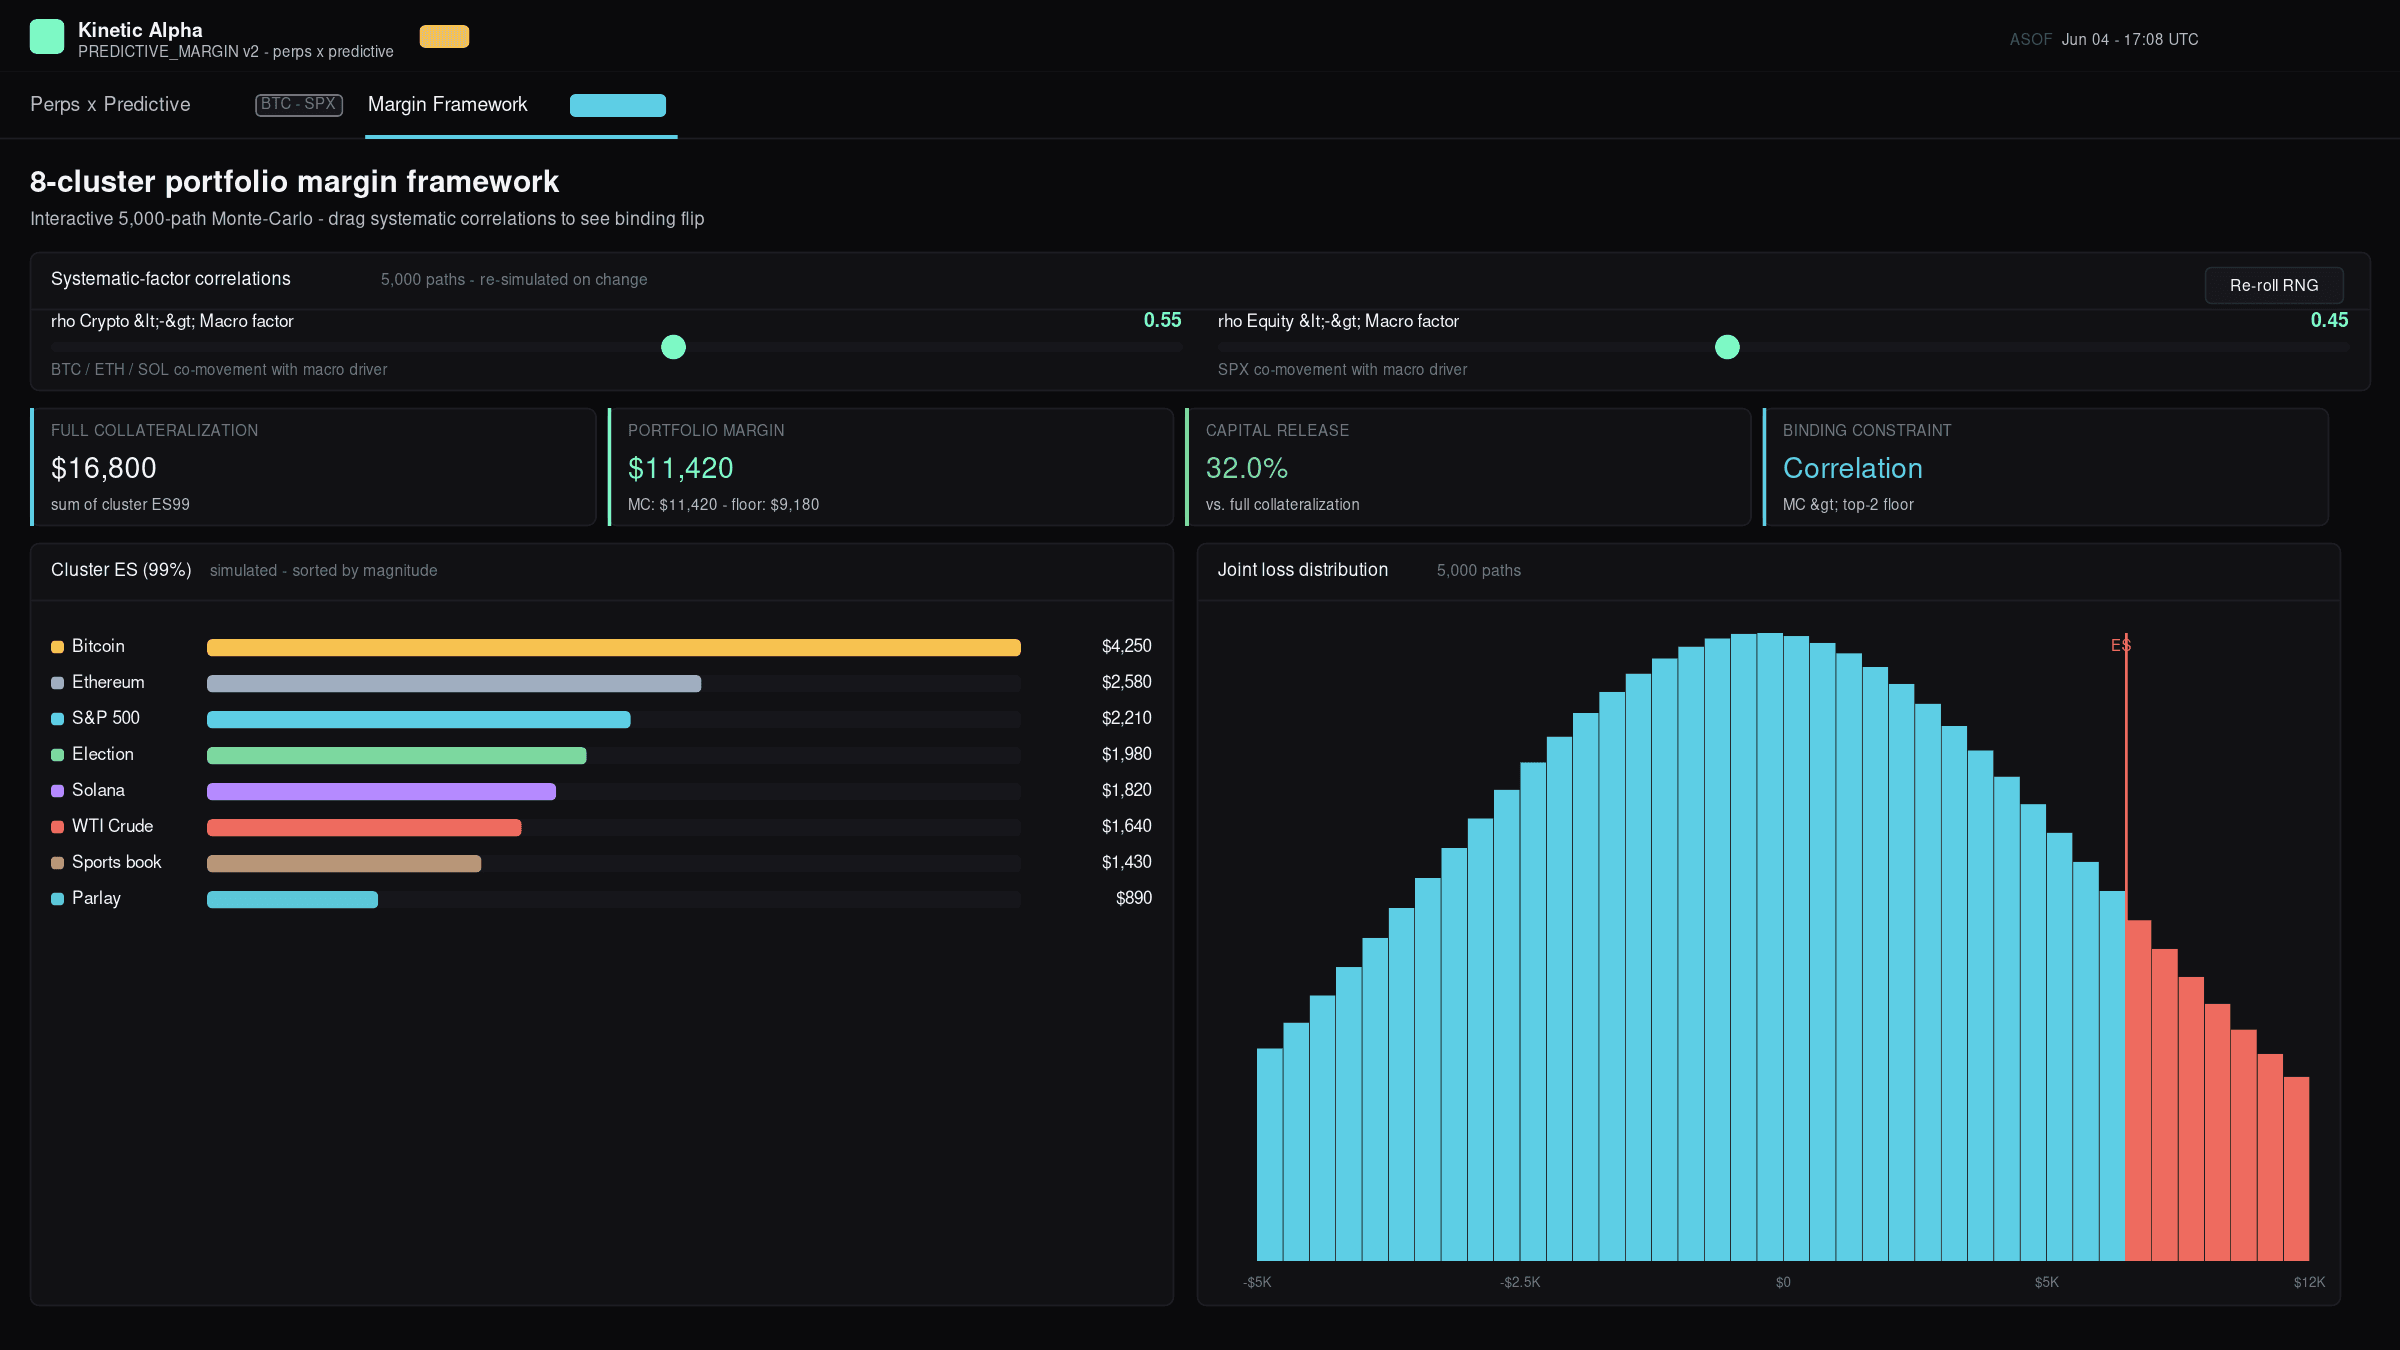
The second tab is a fully interactive 5,000-path multi-factor Monte-Carlo of the 8-cluster portfolio. Two sliders drive the systematic-factor correlations (Crypto↔Macro, Equity↔Macro); every drag triggers a fresh simulation with `useDeferredValue` keeping the UI thread responsive. The KPI strip shows live full collateralization, MC-derived portfolio margin, capital release %, and — most importantly — the binding constraint, which flips between 'Correlation' and 'Top-2 floor' as you move the sliders. Below: a sector-colored cluster-ES bar chart and a joint loss distribution histogram with the ES99 marker drawn across the tail.
Drag both sliders to ~0.7 and the binding constraint flips from 'Top-2 floor' to 'Correlation' — that's the framework paper's headline insight made literally clickable. Drop them back to 0.2 and the floor binds again because cross-cluster shocks decorrelate. The Re-roll RNG button lets you see Monte-Carlo noise — useful for sanity-checking sensitivity.
The thesis
Linear vs. digital — the same underlying, two payoff shapes.
A perp tracks spot one-for-one — its delta is constant at +qty and its PnL is linear. A Kalshi binary "S > K by T" has a digital payoff with delta that peaks near the strike and decays away from it — so a strip of binaries at multiple strikes builds a step function payoff and a bell-curve delta surface.
The two instruments share the same underlying but their PnL shapes are fundamentally different — and that's where the analytic interest lies. A long perp + long binary strip at upside strikes amplifies the bullish bet past each strike. A long perp + short binary at the same strike caps your upside (a synthetic covered-call). A short perp + long binary builds an asymmetric structure that profits more in tails than at the median. Cross-margining them isn't conceptual — it's just summing two delta surfaces and watching where they cancel.
With Kalshi's BTCPERP approval (May 29, 2026) and Coinbase's Deribit-via-FCM pathway, the universe of regulated perp products with matched Kalshi binary strips just multiplied. Cross-asset views like this one stop being illustrative and start being load-bearing for the trading book.
On the math
What the engine does.
The perp leg
A long perp position with quantity q at entry spot S₀ has PnL q × (S − S₀) at any current spot S. Delta (∂PnL/∂S) is constant at q. No curvature, no time decay; the funding mechanism keeps the contract tethered to spot continuously.
The binary leg
A Kalshi binary "S > K by T" pays $1 if the underlying clears the strike at expiry, $0 otherwise. Under risk-neutral pricing (with rates and dividends approximated as zero for sub-year contracts):
- Price =
N(d₂)whered₂ = (ln(S/K) − σ²T/2) / (σ√T) - Delta =
φ(d₂) / (S × σ × √T)— peaks when S ≈ K, decays as the strike moves far away - Implied probability of the event ≈ binary's market price
Portfolio aggregation
Net delta = perp_qty + Σ binary_qty × digital_delta(S, K, T, σ). The "delta-hedge perp lots" KPI shows how many perp lots would flatten the binary book at the current spot — this is the perp's natural role as a continuous delta tool against a step-shaped binary portfolio.
The PnL curve
For each spot in a scanning range, the engine computes the perp's linear PnL plus each binary's digital PnL, and renders the total. The chart makes the asymmetry visible — perp PnL is a straight line; binary PnL has flat-then-step regions corresponding to each strike clearing.
Implied probability extraction
For binaries at the same expiry, prices give P(S > K) at each strike. Differences between adjacent strikes give bucket probabilities (P(K_i < S < K_{i+1})), letting you read a market-implied distribution off the strip directly.
Limitations & caveats
Read before drawing conclusions.
This is a research and education tool. It is not investment advice, not a trading system, and not a settlement-grade risk system. Specifically:
- Sample portfolios are illustrative. The BTC and SPX positions shown are constructed to demonstrate the analytics, not real books.
- Black-Scholes assumes log-normal spot and constant vol. Real crypto spot has fat tails, jumps, and stochastic vol — so the risk-neutral "implied probability" from a binary price differs from the true market expectation, often materially in crypto.
- Zero rates assumed. Acceptable for sub-year Kalshi contracts; the small rate adjustment doesn't materially change the cross-asset shapes the dashboard surfaces.
- No transaction costs, slippage, or funding-rate friction. The perp's linear PnL is the spot move; in reality you pay 8-hour funding (Kalshi) or hourly (Hyperliquid) which compounds against you when long-funded.
- The Margin Framework tab is a reference view. The full interactive 8-cluster Monte-Carlo lives in the v1 legacy dashboard and the framework PDF. Bringing that engine into v2 as a fully interactive port is on the roadmap.
- Political event cross-margining is not yet modeled. Elections, Clarity Act, war scenarios — these need event-specific delta models that aren't in this build.
On deck
What's next.
- Live binary prices. Replace static entry prices with a Kalshi-API mark layer once a feed contract is in place.
- Political event modeling. Election outcomes, regulatory events (Clarity Act, MiCA milestones), war scenarios — each as a named-state Markov layer that overlays the perp linear delta.
- Full Monte-Carlo port. Bring the 8-cluster cross-portfolio margin engine from the v1 dashboard into v2 as a native interactive component.
- Vol surface. Replace single-σ assumption with a per-strike, per-expiry surface fit from the binary strip itself (model-implied vol backed out of digital prices).
- ETH + SOL underlyings. Extend the two-asset model to full crypto coverage with cross-correlation aware margining.
Artifacts & downloads
Daniel Kaufman · Kinetic Alpha. Code and methodology are shared for research and education. No warranty is made as to fitness for any particular use; not investment advice; not a trading system.